
Semiconductor news this summer has been nothing short of ‘historic.’
Memory prices have surged, semiconductors accounted for 38.7% of Korea’s total exports in the first half of this year, and the combined market capitalization of Samsung Electronics and SK Hynix has exceeded half of the KOSPI.
However, in early September, a number with a completely different tone emerged.
It was the news that China’s ChangXin Memory Technologies (CXMT) achieved a 10% DRAM revenue market share for the first time.
It felt strange to see a boom and a chase happening simultaneously.
When I opened the Sejong Institute’s policy brief from September 14, titled “The Current Status of China’s Semiconductor Rise and Korea’s Response Tasks,” I found a sentence that perfectly captured that discomfort.
The current AI demand and supply shortage are absorbing the effects of China’s capacity expansion, masking the pressure. It means that the moment demand cools, the hidden supply will be revealed all at once.
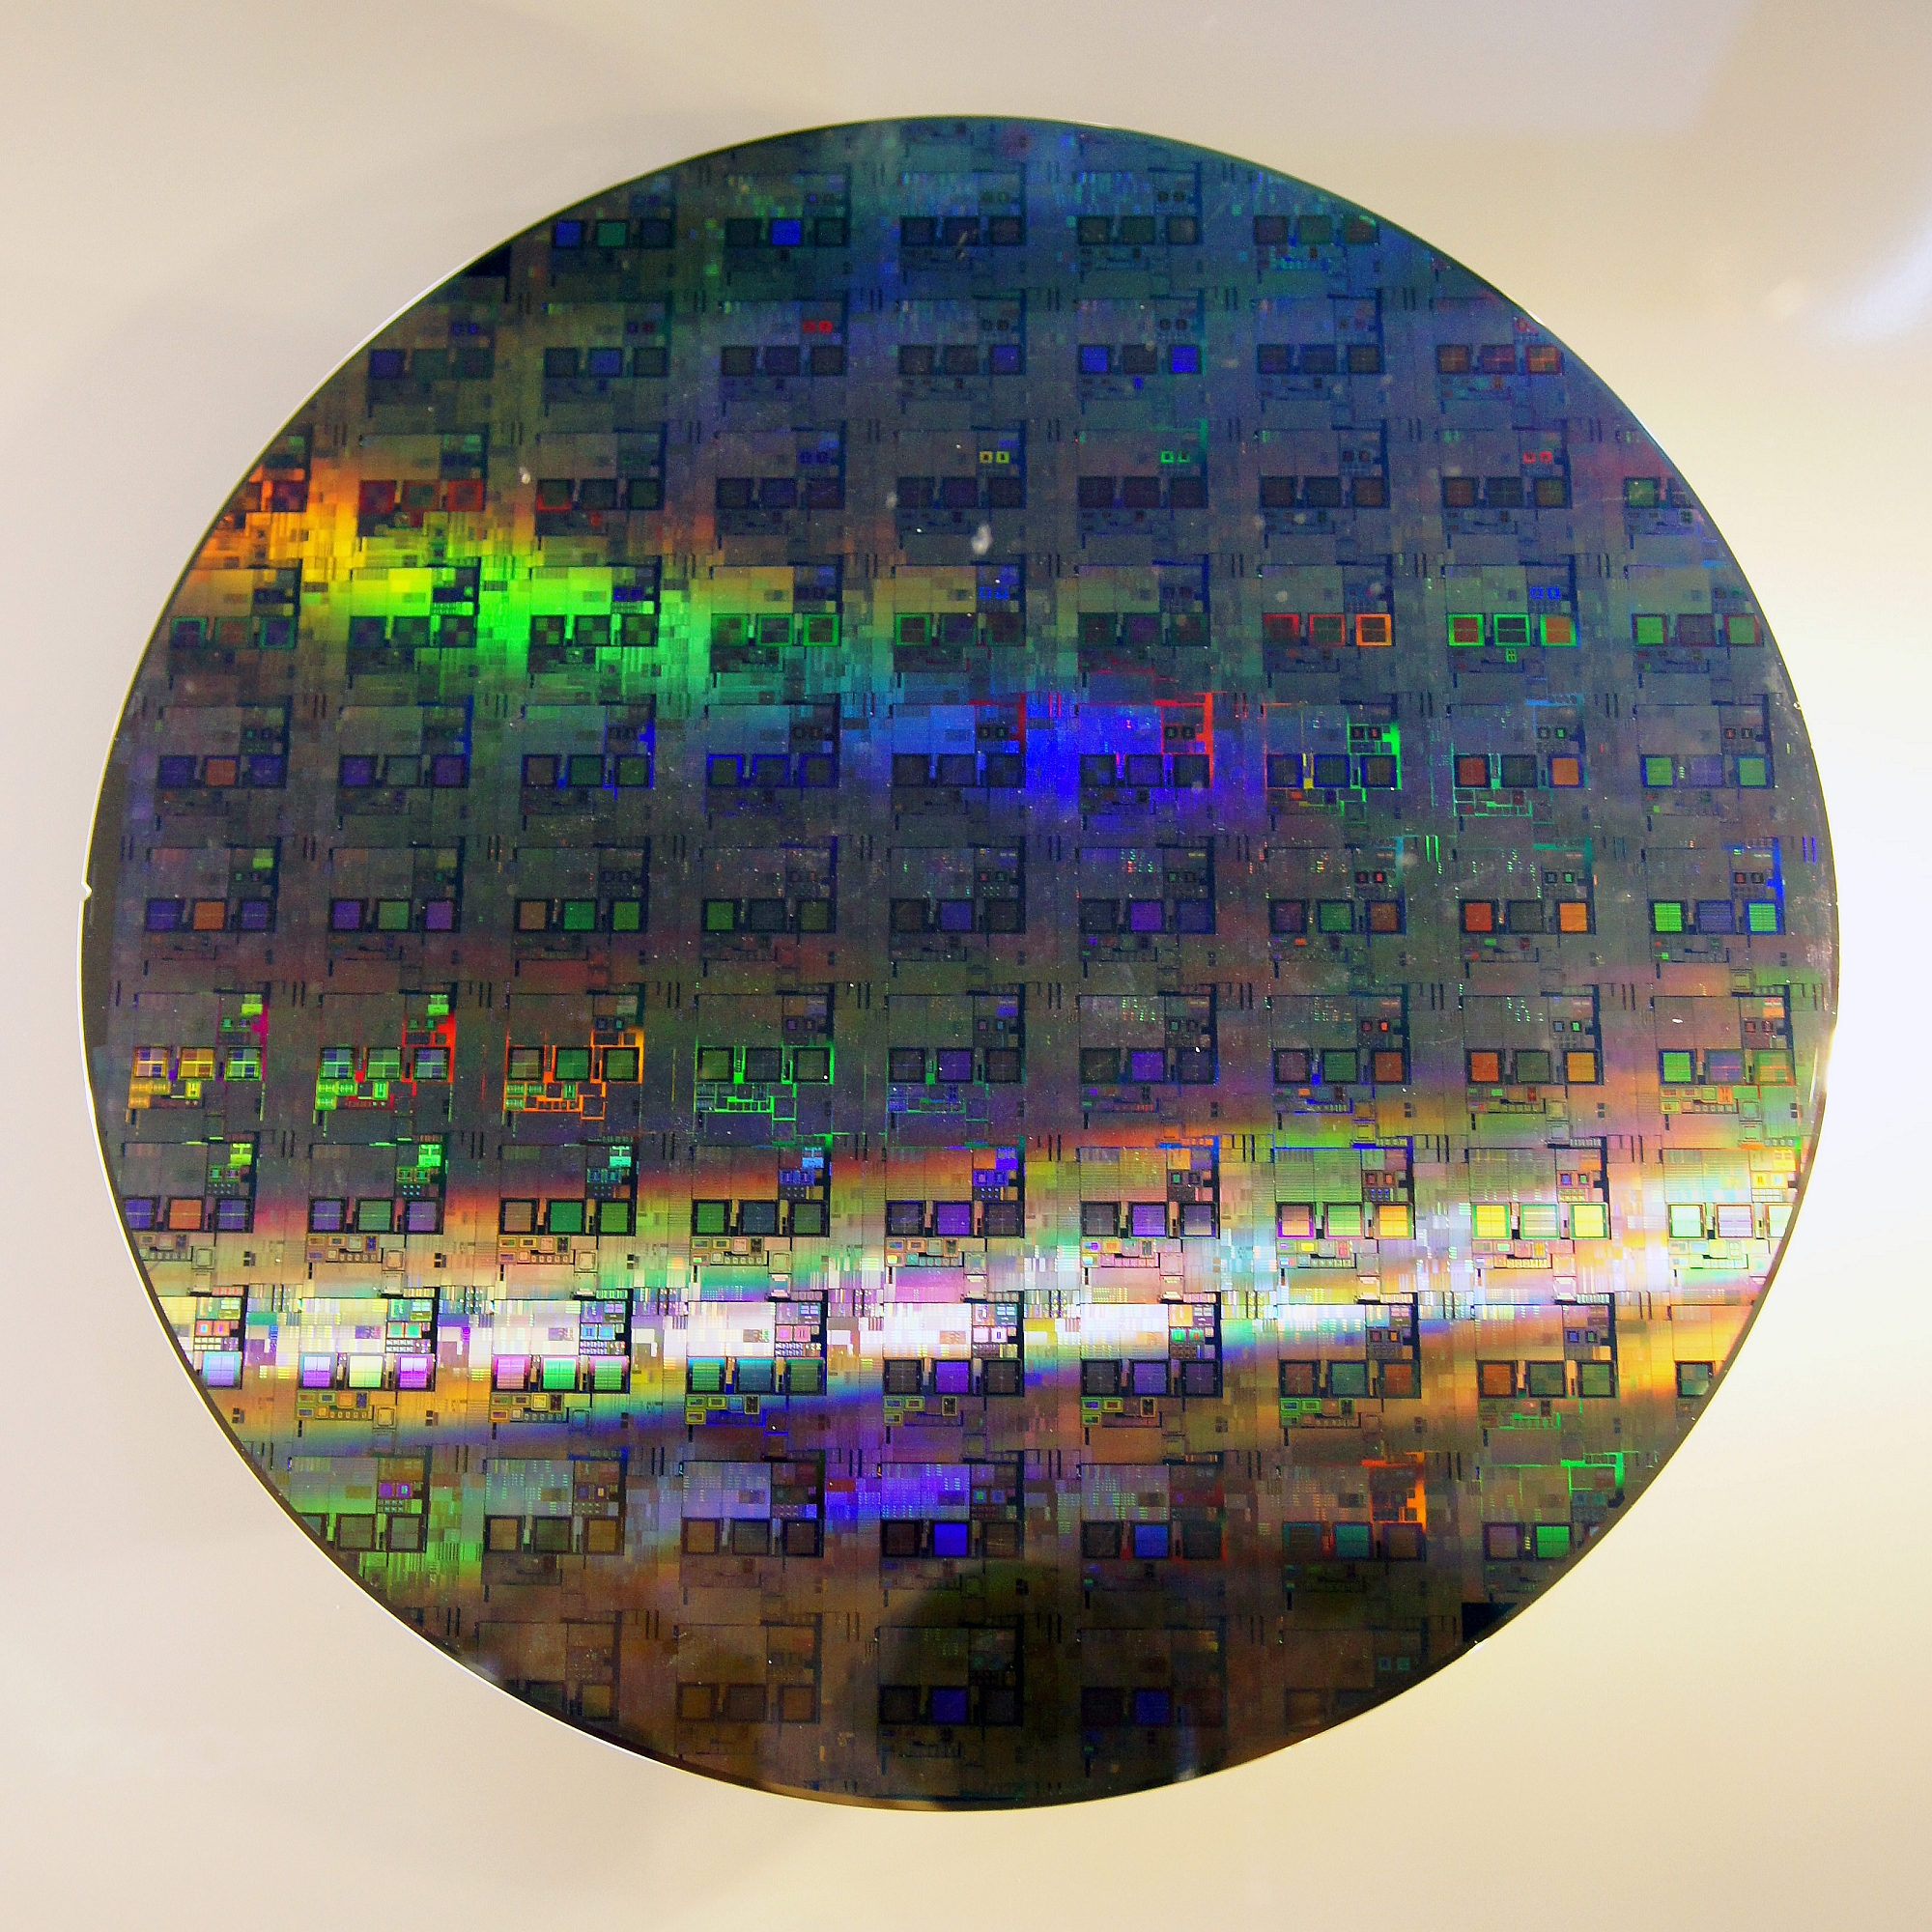
Measuring the Chinese Semiconductor Threat by ‘Technology Gap Years’ Misses the Point
If you only measure the Chinese semiconductor threat by the technology gap, you might feel reassured by HBM and miss what is happening in the commodity market.
This is because the speed of pursuit varies by sector. The brief calls this an ‘asymmetric pursuit’ in the order of NAND → commodity DRAM → HBM.
Here is a summary of China’s semiconductor gap by sector:
| Sector (Chinese Leader) | Current Position | Gap |
|---|---|---|
| NAND (YMTC) | 267-layer mass production, 300+ layer development | Approx. 1~2 generations |
| Commodity DRAM (CXMT) | G4 (approx. 16nm class) mass production | Approx. 2~3 generations, 3~4 years in time |
| HBM (CXMT) | HBM3 trial production, HBM3E small-scale production | Approx. 3~5 years in real mass production competitiveness |
Looking at HBM alone, the gap seems quite large.
According to SemiAnalysis estimates, CXMT’s HBM3 8-high comprehensive yield is around 25%. Since this implies that for every four wafers put in, only one is salvaged, it is difficult to pass the certification of customers like NVIDIA in this state.
The problem is the structure of capital flow.
In commodity DRAM and NAND, even if the technology is slightly behind, selling a large volume at a low price increases market share. As share grows, mass production experience accumulates, yields rise, costs fall, and that capital is reinvested into facilities. This is the cycle the brief warns about.
Price dominance could be shaken before they even catch up technologically.
Where Did CXMT’s 10% DRAM Market Share Come From?
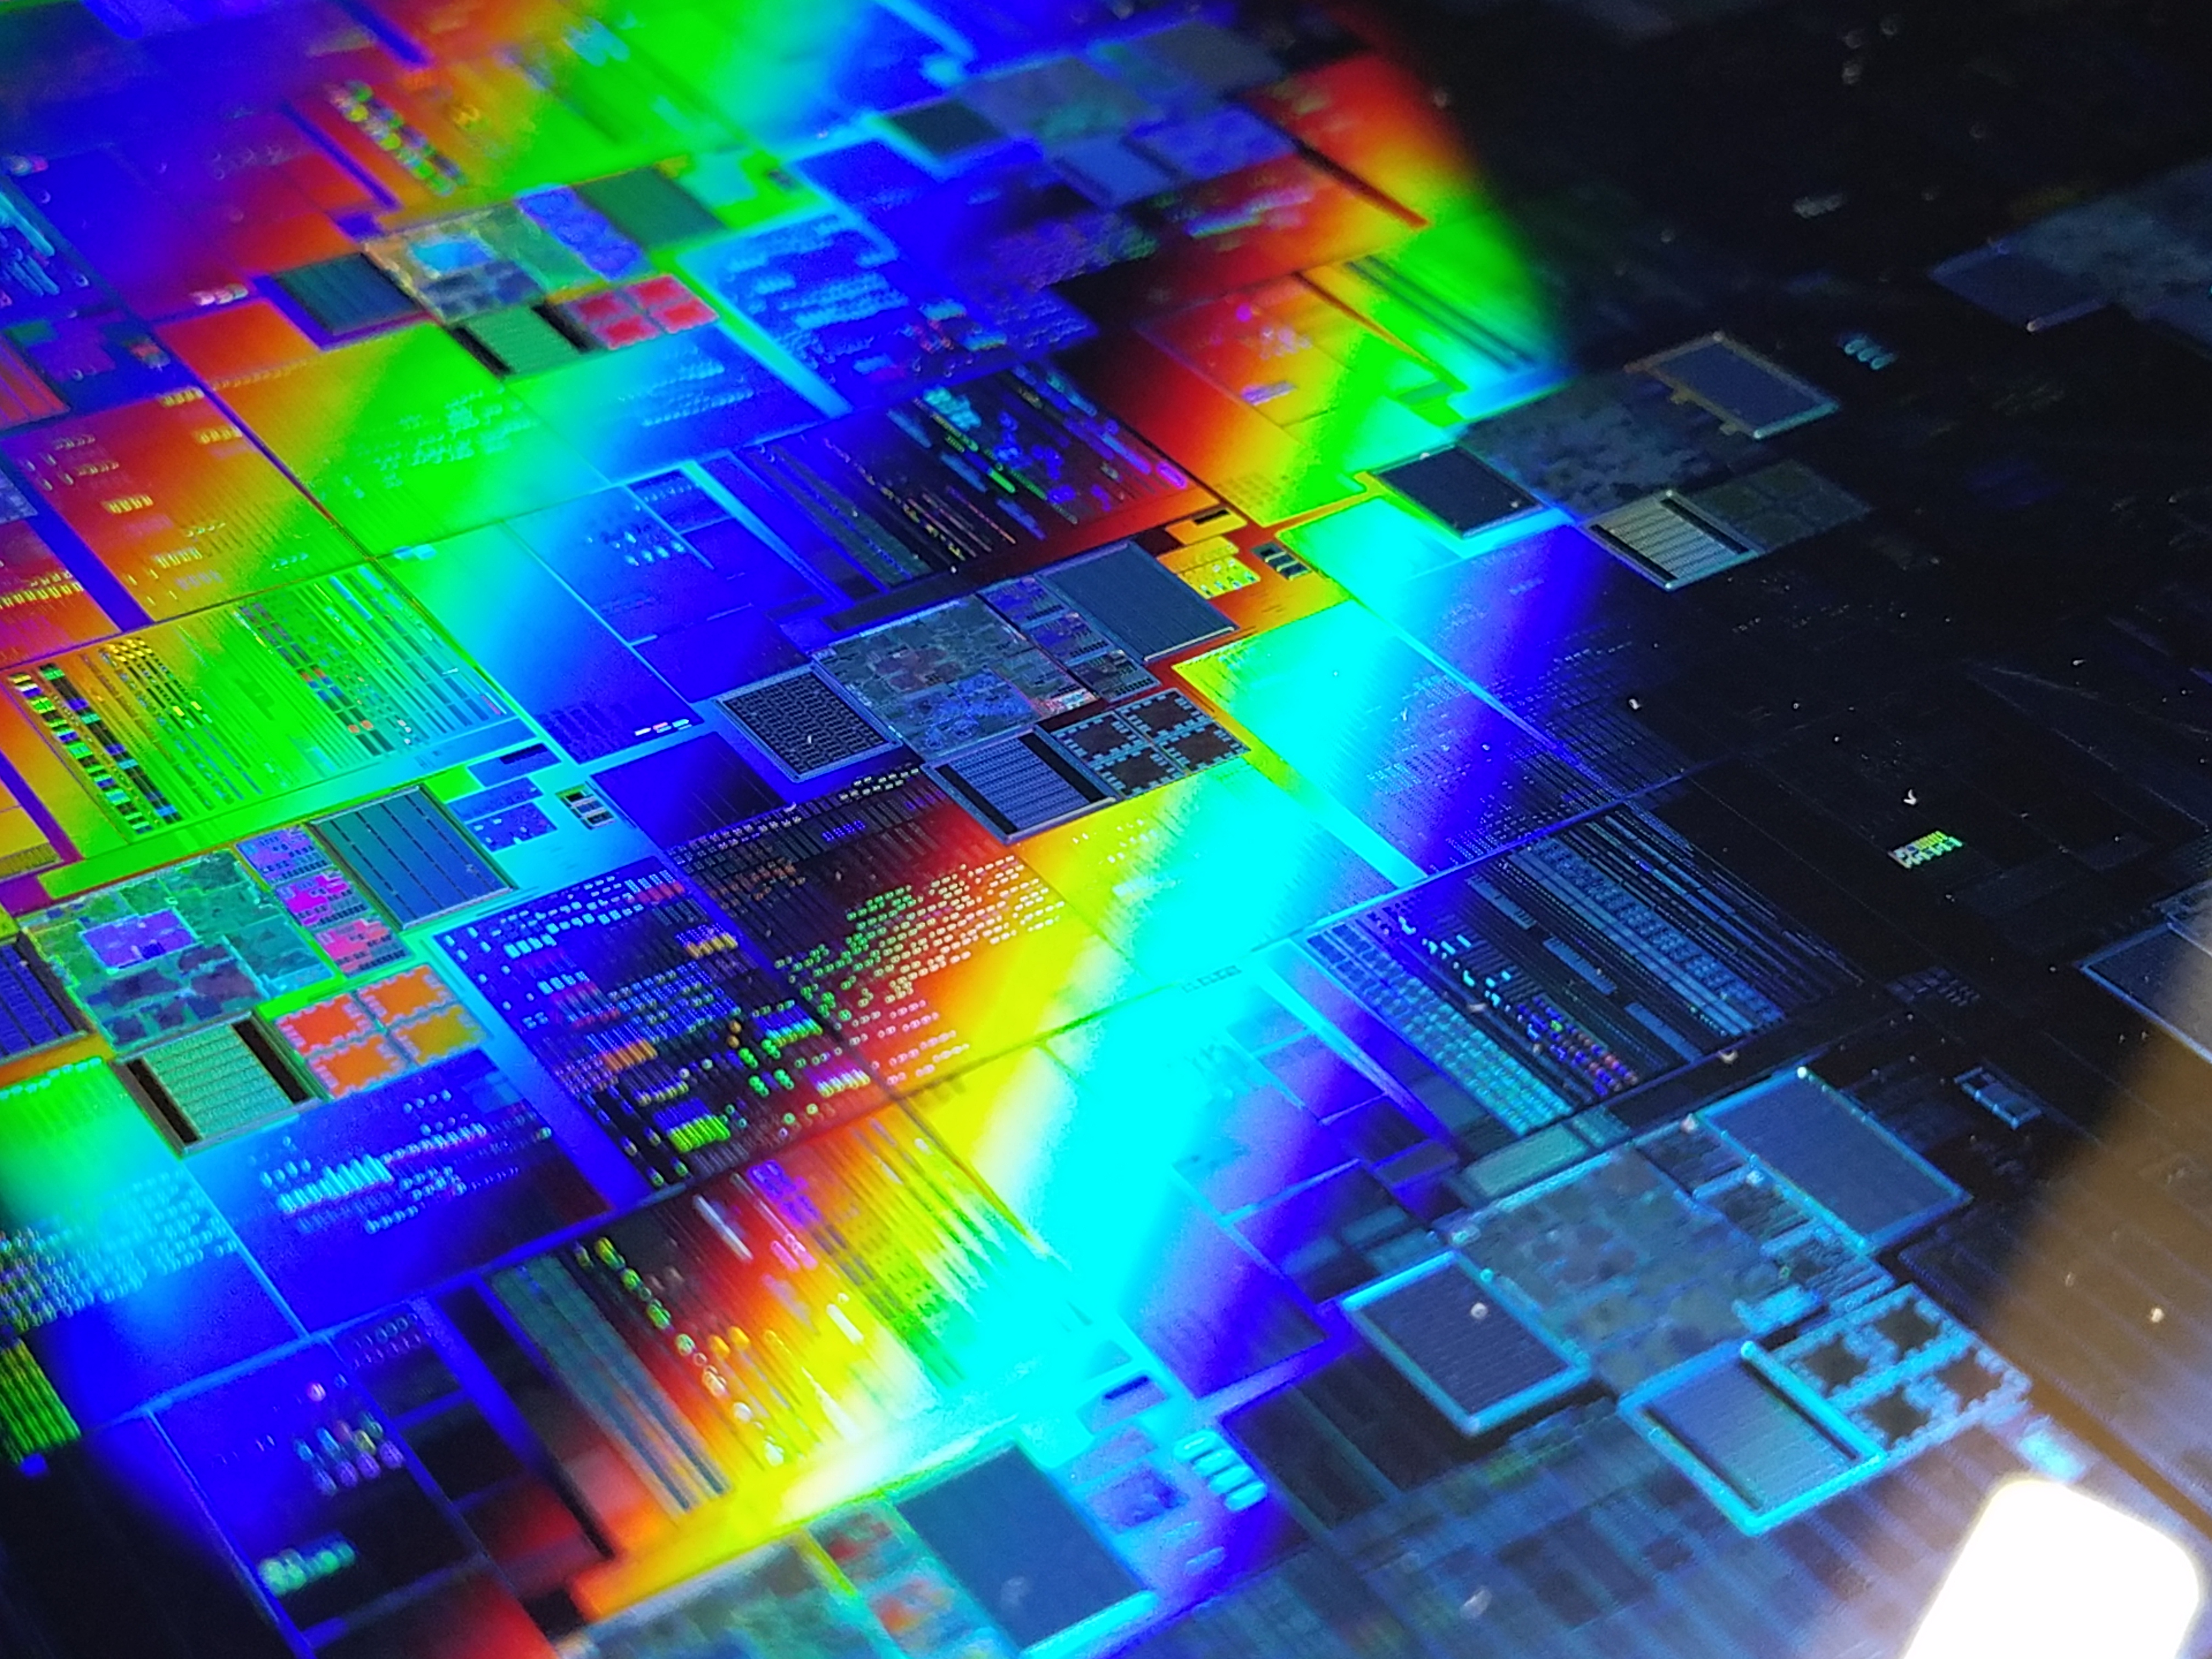
CXMT’s DRAM share came from the space vacated by Korean companies as they shifted production capacity toward HBM.
According to Counterpoint Research, their share rose from 3% in Q1 2025 to 8% in Q1 2026, and 10% in Q2 2026. This is more than double the share (4%) from the same quarter a year ago.
During the same period, SK Hynix fell from 39% to 25%. It would be inaccurate to blame this entirely on CXMT.
Samsung Electronics increased from 33% to 38%, and Micron also followed up to 24%, so internal competition between Korean firms and the ‘Big Three’ is also at play. The brief also views the gap between Micron (24%) and CXMT (10%) as still significant, seeing it as the early stage of a crack in the 3-player structure rather than a full ‘4-player system.’
But the crack is spreading fast.
On September 20, CXMT announced the entry into mass production of its 5th generation (G5) DRAM platform. They claim to have increased the number of chips per wafer by over 50%. Since they were ‘developing G5’ when the brief was published, they moved forward by a step in just one week. However, CXMT did not disclose the yields or cost-per-chip for G5.
As of Q1 this year, CXMT’s cost per bit was estimated to be over 30% higher than the top three firms. An increase in chip count does not mean costs drop by the same ratio.
Sales channels are also expanding. Reports emerged that HP, ASUS, and Acer have begun using CXMT DRAM in some laptops for markets outside the U.S., and Apple is also rumored to have reviewed procurement possibilities. It has not been confirmed if the Apple case led to actual supply.
Source: 2x910 / Wikimedia Commons, CC BY-SA 4.0
Why the AI Boom Masks the Increase in Chinese Semiconductor Supply
Because the current market sells everything it produces, how much more one produces is not reflected in the price. This is the most important point I want to make in this article.
Based on WSTS data, the brief estimates that the global memory market will grow 5.6 times from $165.5 billion in 2024 to approximately $924.6 billion in 2026. The proportion of memory in the total semiconductor market will jump from 26.3% to about 55.9%. When demand explodes to this extent, the market absorbs everything, even if China runs a few more factories. Prices actually rise, and Korean firms post record-high earnings. It is a structure where the traces of pursuit are not visible on the earnings report.
However, the picture changes when looking at production capacity forecasts.
CXMT’s DRAM production capacity will grow from 265,000 wafers (12-inch equivalent) (14%) to 500,000 wafers (18%) by 2028.
Samsung Electronics will increase from 705,000 to 880,000 wafers, but its share will shrink from 38% to 32%, and SK Hynix will drop from 29% to 27%. In NAND, YMTC will rise from 11% to 16%. Korean companies are also building factories, but China is building them faster.
Honestly, I found this forecast more chilling than the headline about CXMT’s 10% share.
Market share is a result that has already occurred, but production capacity is what will happen in the future.
The real problem arises when demand falters.
The memory market naturally alternates between booms and busts, and during busts, firms survive by cutting production. However, because Chinese firms are backed by policy finance and local government support, they can prioritize market share over short-term profits.
If they delay production cuts even during a downturn, commodity DRAM and NAND prices will crawl along the bottom for a long time.
The brief compares this path to the display industry. It is the same path where China pushed out Korea’s leading position in the LCD market through sheer volume.
The 15% Threshold: YMTC Will Reach It Before CXMT
In the memory industry, there is a line that determines whether a latecomer survives.
It is the approx. 15% bit market share suggested by Counterpoint Research. If you fall below this line, you cannot generate enough money to pour into the next generation of factories.
The basis for this is Taiwan in 2008. At that time, Taiwanese DRAM firms saw their market share drop below 15%, failed to secure funds for next-generation investments, and were eventually relegated to niche players with about 3% share.
Memory is an industry that requires trillion-won facility investments every time a process generation is skipped, so once you miss out, it is almost impossible to catch up.
By this metric, the one closer to the line is not CXMT, but YMTC.
YMTC reached 14% in NAND bit shipments in Q2 of this year, surpassing Kioxia to become the world’s third-largest for the first time. In terms of revenue, it is also at 14%, tied with Kioxia and only 1 percentage point behind Micron (15%). CXMT is at 10% for DRAM revenue and about 9% for bits, with Counterpoint projecting a bit share of about 11% by 2028.
YMTC also has weaknesses.
Its products are mostly for consumers, so the proportion of high-margin enterprise SSDs (eSSD) for data centers is small. With 48% of total NAND shipments in Q2 being server-side eSSDs, this means their presence in the profitable market is still weak.
The Paradox: U.S. Sanctions Have Fueled China’s Localization of Semiconductor Equipment
While U.S. export controls were effective in blocking China’s access to cutting-edge technology, they simultaneously became the strongest reason for China to use its own equipment.
According to AnySilicon data citing Yole Group analysis, China’s semiconductor equipment localization rate rose from 8% in 2021 to 23.2% in 2025, and is projected to reach about 39% by 2030.
Pressure from the Chinese government also played a role. Reports emerged that new or expanded semiconductor factories must meet a requirement to fill at least 50% of new equipment with domestic Chinese products to receive approval. While there are no public documents, it is said that approval is generally denied if the criteria are not met.
The results were directly reflected in the books of overseas equipment companies.
KLA’s China revenue share fell from 42.8% (FY2024) to 29.8% (FY2026), Lam Research dropped from 42% to 34%, Applied Materials from 37% to 30%, and ASML from 36.1% to 29.1%. Chinese equipment firms filled that void.
Naura has moved from 8th place in global equipment revenue in 2022 to 5th in 2025.
That does not mean China is running without obstacles.
They have still not crossed the threshold for EUV lithography equipment, the gateway to the cutting edge. The EUV localization attempt, which Reuters called ‘China’s Manhattan Project,’ succeeded in generating a light source in early 2025 but failed to produce chips. The government’s goal is 2028, but project insiders see around 2030 as more realistic.
There are also cases where money was poured in and failed. Wuhan Hongxin (HSMC) had about 15.3 billion yuan invested out of a planned 128 billion yuan before the business was suspended and liquidated.
How Much Time Does Korea Have During the HBM Boom?
The brief’s policy suggestions all converge on one point.
Use the time and money HBM is earning now to create the next gap.
There is a warning attached that if the boom masks structural changes, the organization’s sense of urgency will dissolve, and investments in production bases, materials/components/equipment, and talent will be pushed to the back burner.
Two suggestions stood out.
First, do not give up on commodity memory.
Even if commodity DRAM and NAND seem to have lower profit margins than HBM, they are the foundation for accumulating process experience through mass production and generating cash.
You must maintain a cost structure and key customers that can survive even in a price-collapse phase to afford funding for advanced technology.
The 15% threshold mentioned earlier is not just about China.
Second, it is about people. There is an industry estimate that over 200 Koreans work at CXMT.
Semiconductors are an industry where tacit knowledge—such as tricks for increasing yields and equipment settings—remains in people’s heads.
If one key expert moves, years of trial and error go with them.
This is why the brief calls for managing talent from a national security perspective.
Time is not on our side.
As of July this year, 30.1% of Korea’s memory semiconductor exports went to China.
As Chinese customers have more options to switch to CXMT and YMTC, the bargaining power behind this 30.1% will weaken first.
Furthermore, the fact that SK Hynix produces about 35~40% of its DRAM and 40~45% of its NAND in its Wuxi and Dalian plants in China, and Samsung Electronics produces about 30~35% of its NAND in Xi’an, is certainly not favorable news for Korea.
References
- Sejong Institute, Lee Byung-chul, "The Current Status of China's Semiconductor Rise and Korea's Response Tasks – Focusing on Memory Semiconductors," Sejong Policy Brief No.2026-25 (2026. 9. 14.)
- Counterpoint Research, Global DRAM and HBM Market Share: Quarterly
- Counterpoint Research, Global NAND Memory Market Share: Quarterly
- Counterpoint Research, Server-led eSSDs Hit 48% of NAND Shipments (2026. 8. 12.)
- Counterpoint Research, Capital-Rich CXMT Eyes the 'Big Three' Memory Club (2026. 7. 15.)
- WSTS, Global Semiconductor Market records exceptional growth in Q2 2026 (2026. 8. 6.)
- SemiAnalysis, China's CXMT Is Set to Challenge DRAM (2026. 6. 23.)
- Seoul Economic Daily, CXMT DRAM Market Share Surpasses 10% (2026. 9.)
- Dailian, China's CXMT Enters Mass Production of 5th Gen DRAM (2026. 9. 21.)
- AnySilicon, China's Semiconductor Equipment Localization Enters a New Growth Phase (2026. 6. 23.)
- Reuters, China mandates 50% domestic equipment rule for chipmakers (2025. 12. 30.)
- KLA Corporation, Annual Report on Form 10-K FY2026
- Reuters, How China built its Manhattan Project rival to the West's AI chips (2025. 12. 17.)