
From September 1st to the 20th, exports to China surged by 113.8% compared to a year ago. That is more than double the previous figure.
Building on this momentum, Korea has regained the #1 spot in exports to China—or, to be precise, the #1 position in China’s import market—for the first time in 7 years.
This is the result of exports to China skyrocketing by 76% from January to August, pushing Taiwan into second place.
Reclaiming the #1 Spot in Exports to China: How Significant Is It by the Numbers?
Between January and August of this year, the share of South Korean goods in China’s total imports reached 9.5%, surpassing Taiwan and Japan to claim the top spot.
According to the ranking changes summarized in the Korea Center for International Finance report, Korea ranked 1st in 2019, fell to 3rd in 2020, and remained in 2nd place from 2021 through 2025. This year, it has returned to the top.
The speed of this increase is also unprecedented.
The 76% growth rate in exports to China from January to August is the highest in approximately 30 years.
The share of China in total South Korean exports also rose to 21.0%, up 2.6 percentage points from the previous year. After hitting 25.9% in 2020, it had fallen for six consecutive years before rebounding to break the 20% mark again. If Hong Kong is included, the figure reaches 29%.
The shift in the trade balance is even more dramatic.
According to Korea Customs Service data cited by the Kookmin Ilbo, the trade balance with China from January to August recorded a surplus of $27.678 billion. In the same period a year ago, there was a deficit of $8.846 billion.
While comparing the numbers, one discrepancy caught my eye.
In the same article, China’s statistics show an import growth rate from Korea of 72.2%, while the Korea Customs Service reports a 76.1% growth in exports to China. Because one side uses importing country customs clearance and the other uses exporting country customs clearance, there is a difference of a few percentage points due to transit times and calculation methods. Regardless of which number you look at, the conclusion that Korea is in 1st place remains the same, which is why growth rates vary slightly between reports.
A 76% Surge in Exports to China: Half Was Memory Semiconductors
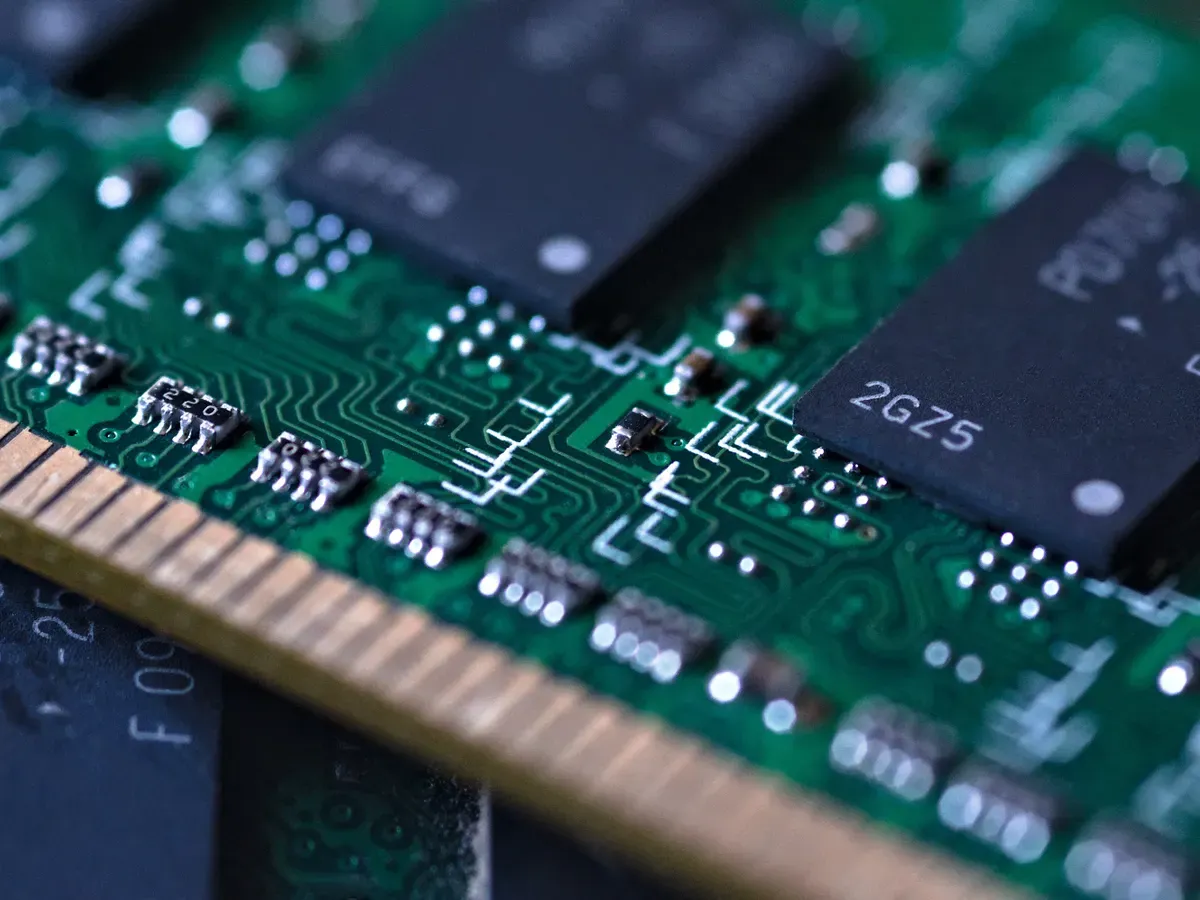
Memory chips drove the rise in exports to China. Memory semiconductors (HS 8542.32) account for half of Korea’s exports to China, and 5 of the top 10 items are semiconductor-related. The concentration is even clearer when looking at the growth rate by item from January to August.
Memory chips increased by 326%, DRAM modules by 212%, and SSDs by 170%. Conversely, system semiconductors fell by 1.4%, and other semiconductors dropped by 25%. The temperature difference between items is so vast that it is difficult to group them all under the single term “semiconductor.” Demand exploded only in areas where Korea holds a technological edge. The Semiconductor Industry Association estimates the technology gap between Korea and China at 1 year for NAND, 2 years for DRAM, and 3 years for HBM.
If we dig one layer deeper, the nature of this #1 ranking looks a bit different.
South Korean companies account for about 40% of the semiconductors produced by foreign firms within China. These factories must import lower-tier components from Korea to operate. The Korea Institute for International Economic Policy (KIEP) estimates that 22% of total exports to China are transactions between domestic companies and their local Chinese subsidiaries. Based on this, the report suggests that a significant portion of semiconductor exports is actually demand from Korean companies within China.
In other words, the report card showing #1 in exports to China includes a significant volume of parts being sent to factories Korean companies built in China. This is different from saying that Chinese companies have developed a stronger preference for Korean-made goods. This volume could fluctuate significantly based on the investment decisions of Korean semiconductor firms or a single line in U.S. export controls. This is the point where I hesitated to applaud.
Not Just Semiconductors: Export Demand Created by Chinese Policy
Even excluding semiconductors, there is a clear trend.
In its 15th Five-Year Plan (2026–2030), which began this year, China designated quantum technology, biotechnology, hydrogen and nuclear fusion, brain-computer interfaces, AI, and 6G as its six major sectors for development. Exports to China connected to these six areas have all increased. From January to August, exports of electrolyzers jumped by about 1,300%, and exports of robots and temperature control devices grew by over 80%.
Another pillar is “Zhuanjingtexin” (Specialized, Refined, Differential, and Innovative). This is China’s core policy to foster “hidden champions.” Starting this year, China implemented a three-year action plan to nurture excellent companies, increasing the number of key supported small and medium-sized enterprises by 30% to 1,572.
According to an analysis by the Korea International Trade Association (KITA), 85% of the 74 export items where Korea has a comparative advantage and has seen an average annual growth of over 13% from 2015 to 2025 are tied to these “Zhuanjingtexin” sectors.
In this structure, most of what Korea sells are intermediate goods. The share of intermediate goods in exports to China is nearly 91%, compared to 78% for Korea’s global exports. The picture is one where Korea supplies the parts that Chinese SMEs use to manufacture high-tech equipment.
The Spot Japan Lost, Korea Picked Up: The Balloon Effect in China’s Import Market
Rankings were also influenced by the sluggish performance of competitors.
Following Prime Minister Takaichi’s remarks at the end of last year regarding intervention in a Taiwan contingency, China halted imports of Japanese seafood, and this year, it placed about 80 Japanese companies on a monitoring list. As a result, Japan’s share of China’s import market fell by 0.2 percentage points. The U.S. lost 0.7 percentage points during the first Trump administration and another 0.6 percentage points in just one year during the second, reducing its share to 5%.
Interestingly, Korea has experienced similar situations. Past cases summarized in the report show that political conflicts leave clear marks on market share in China.
Comparison of the decline in China’s import market share between the year of conflict and two years later:
This current balloon effect is a gain Korea achieved because it fortunately stood outside the conflict. As the table shows, if the situation changes, Korea’s share could be lost in an instant.
The Paradox of Being #1 in Exports to China in the Year China’s Technical Prowess Overtook Korea
There is another reason why this is not entirely welcome. A comparison by the Presidential Advisory Council on Science and Technology across 11 sectors shows that, with the U.S. at 100, China’s comprehensive technical capability reached 86.8, overtaking Korea in 2022 and Japan in 2024. Korea stands at approximately 83. The gap widened from 1.1 points in 2022 to 4 points in 2024, with the difference being more pronounced in high-value-added fields like ICT/software (-7.4 points) and defense (-6.5 points).
Why is this a problem? Exports last longer when you sell items the other party cannot produce themselves.
According to a comparison by the Korea Institute for Industrial Economics & Trade (KIET), the quality of Chinese intermediate goods has risen to 80% of Korea’s, while the price is only 60%. Once quality reaches this level, Chinese companies have sufficient reason to switch to domestic parts based on price alone. In fact, the share of domestic companies in China’s exports has risen from 54% in 2014 to 73% this year. This means the proportion of products made with their own parts has increased accordingly.
Furthermore, 74% of Korea’s top 10 export items overlap with China’s, up from 65% in 2019.
Electronic devices, machinery, vehicles, plastics, organic chemicals, and precision instruments appear on both nations’ top 10 lists. Semiconductors are no exception. China’s CXMT is set to double its production capacity over the next five years, and China’s semiconductor self-sufficiency rate is expected to rise from 28% this year to 30% next year.
The current #1 ranking was made possible thanks to the gap in a narrow area where Korea still leads: high-performance memory. Outside of that area, the chase is already over or the lead has been reversed. The fact that the year of claiming #1 coincides with the confirmation of this reversal is the key to reading this report card.
Another Variable That Could Shake the #1 Spot: Relocation of Production Bases
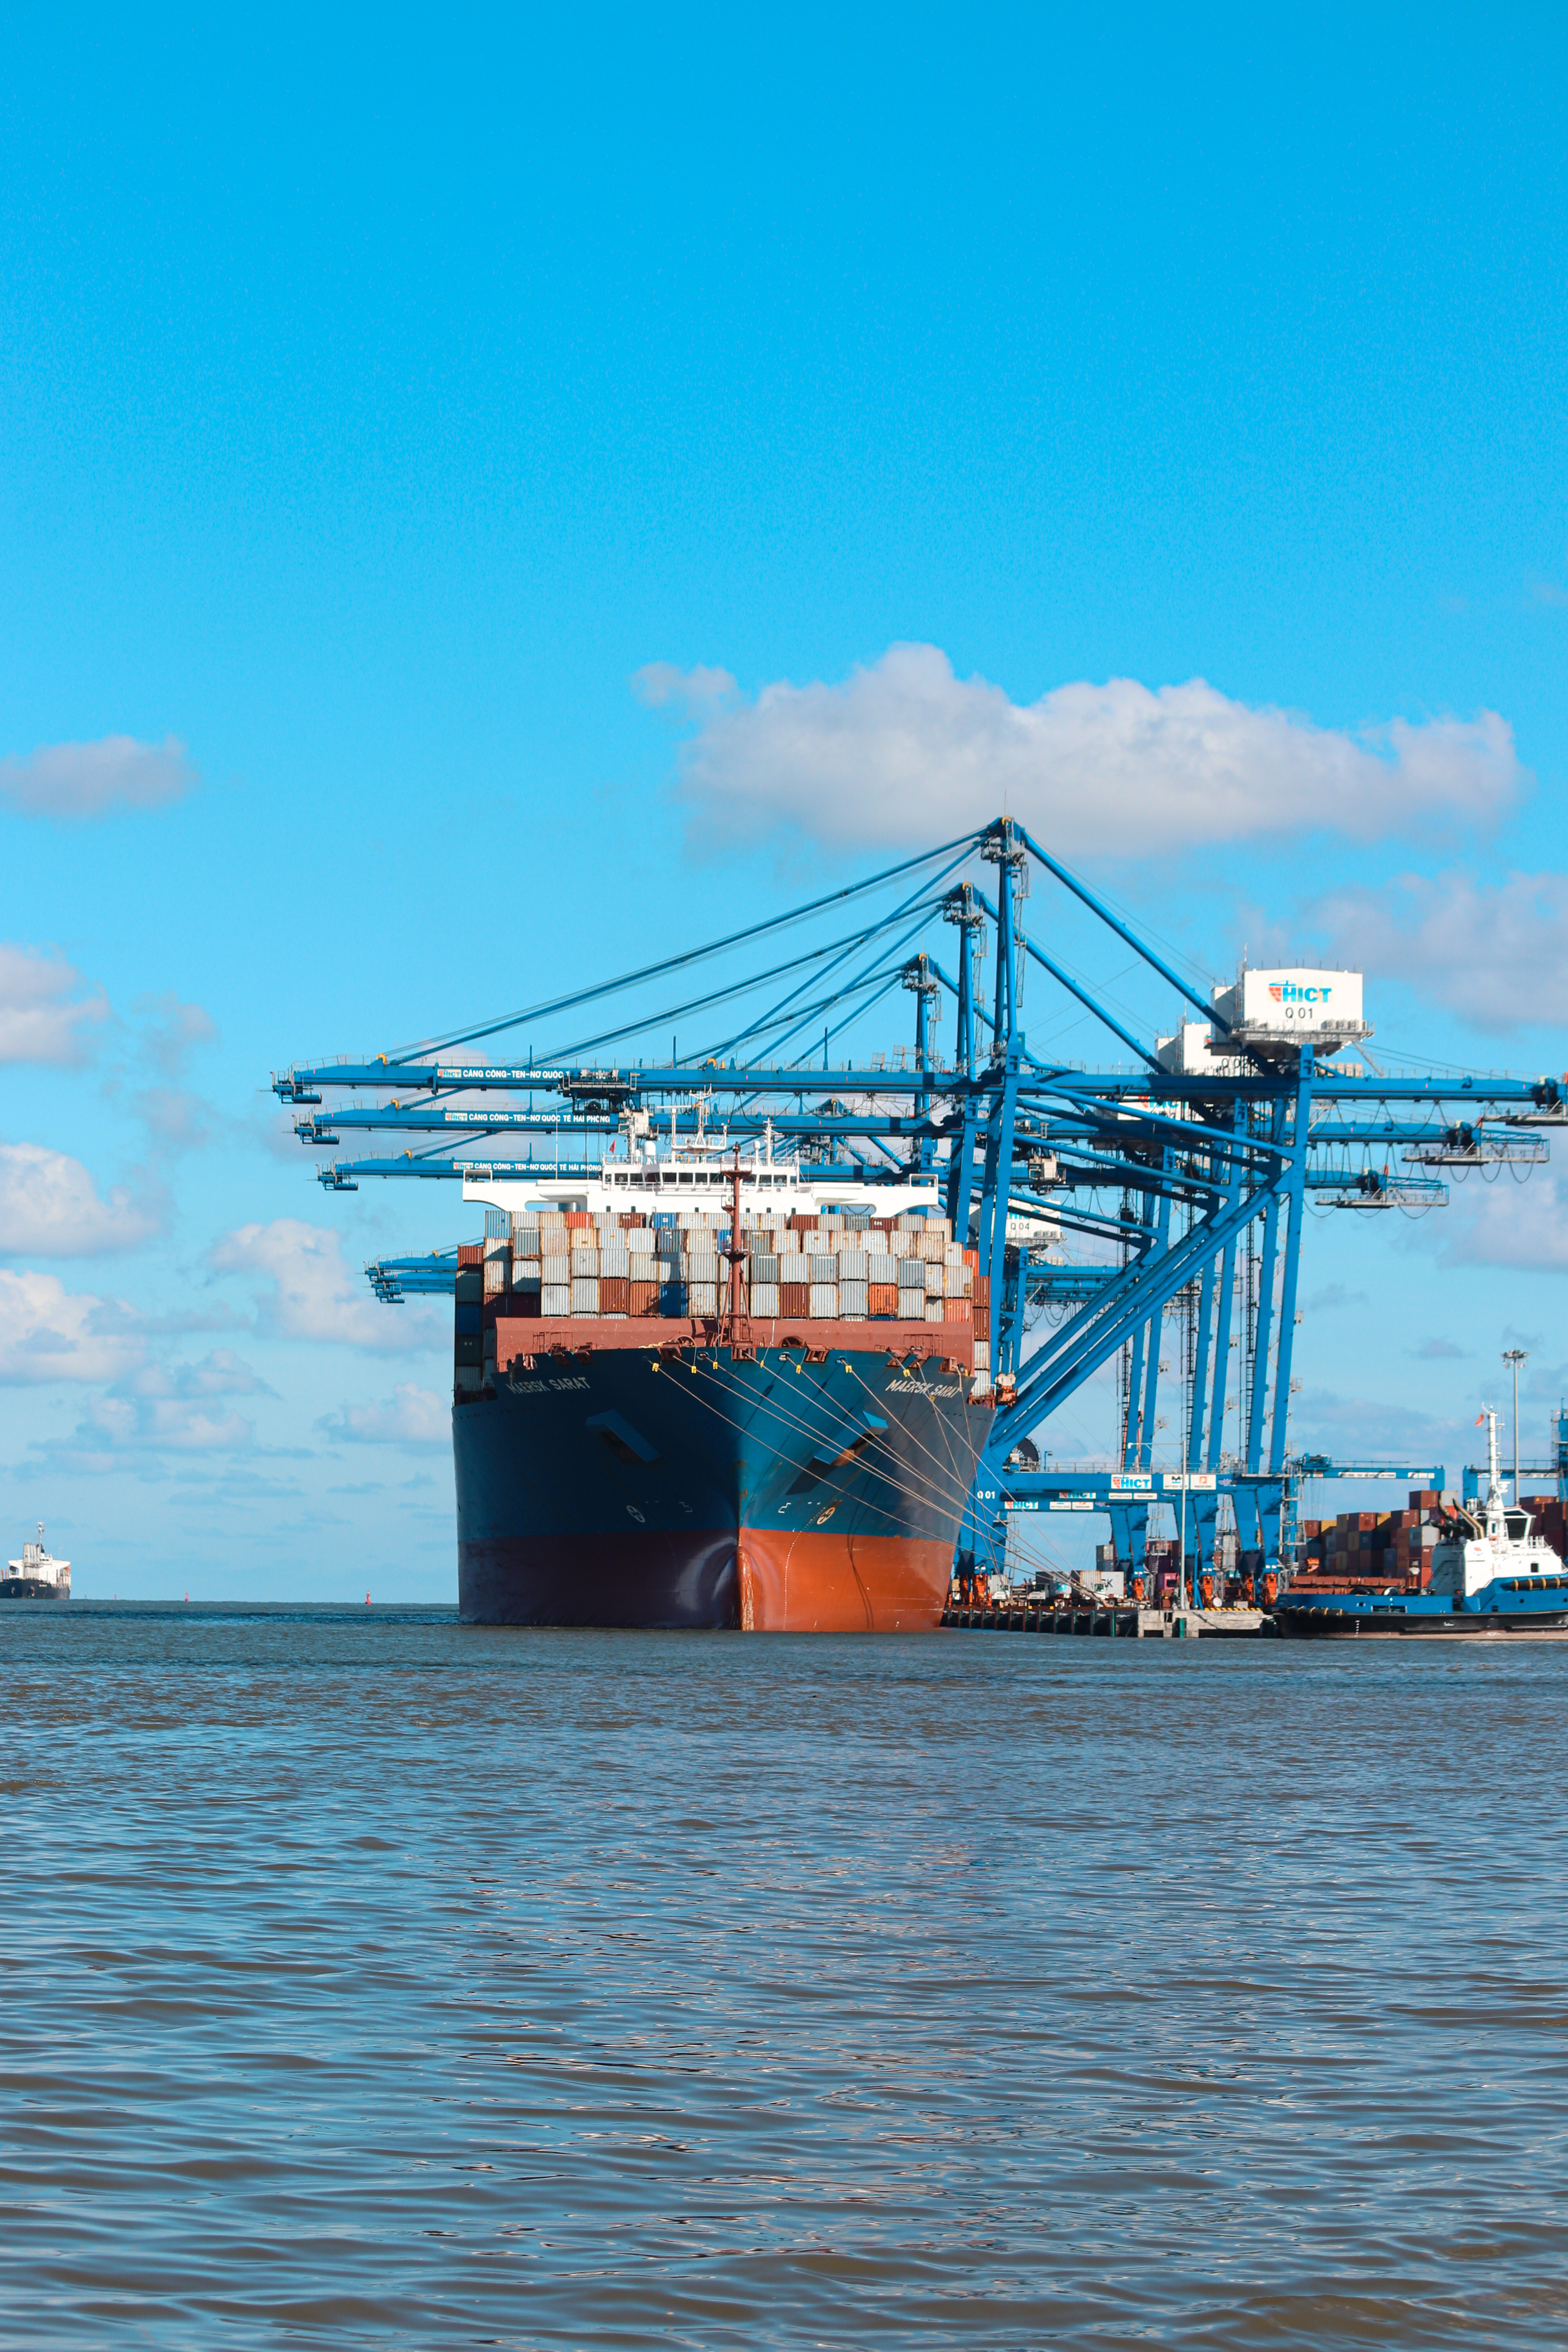
A significant portion of Korean intermediate goods has relied on a structure where they are assembled in China and re-exported to third countries.
However, China’s processing trade share has fallen from 27% in 2014 to 19% this year. Production costs like labor have risen, and the effective U.S. tariff rate on China is 22%, nearly double the global average of 11%. For Chinese companies, the reasons to move factories abroad are mounting.
China’s outward foreign direct investment grew by an annual average of 7% from 2019 to 2024, with the share going to ASEAN nearly doubling from 10% in 2019 to 18% in 2024. Investments in Vietnam and Indonesia increased by over 50% compared to the previous year. If Chinese factories move to Vietnam, the destination for Korean parts changes as well. While a decline in exports to China is not necessarily a total loss for Korean exports, it is a disadvantageous trend for maintaining a high ranking in the Chinese import market.
What Needs to Change to Maintain the #1 Spot in Exports to China for a Long Time?
The report suggests three directions.
One is to broaden the scope of export items from a focus on semiconductors to high-tech parts and services.
Examples of horizontal cooperation include Samsung Electro-Mechanics supplying key EV parts to BYD since last year, and POSCO Future M launching a battery materials plant this year in a joint venture with China’s CNGR.
Performance in the service sector is dismal.
Korea’s service trade balance with China shrank from a $5.7 billion surplus in 2015 to $200 million in 2020, and turned into a $200 million deficit in 2025. During the same period, the U.S. managed to increase its service trade balance with China for three consecutive years despite U.S.-China tensions. This year, the number of Chinese tourists visiting Korea is expected to be 6.66 million (annualized from January to July), marking a five-year consecutive increase, and their per-capita spending is 30% higher than the overall average. This indicates that there is significant room to improve the structure where money earned from goods is leaked in the service sector.
Second is market diversification.
The share of ASEAN in Korea’s exports rose from 11% in 2010 to 18% from January to August this year. However, China is also aggressively expanding into third-party markets. According to a Rhodium Group analysis, BYD electric vehicles are about 30% cheaper than Tesla models with similar performance, and government subsidies account for only 5% of that price difference; most of the price competitiveness comes from production costs.
Third is leveraging U.S.-China tensions as an opportunity.
Seven countries have FTAs with both the U.S. and China: Korea, Australia, Singapore, Chile, Peru, Costa Rica, and Nicaragua; among these, Korea is the only manufacturing powerhouse. Korea’s share in the U.S. import market rose from 2.9% in 2018 to 4.4% in the first half of this year, while China’s share plummeted from 21.1% to 7.9% during the same period. In 2024, the scale of China’s direct investment in Korea surpassed that of the U.S. for the first time.
The logic of filling in the gaps lost in one market with another has worked in Korea’s favor so far.
The result of being #1 in exports to China is one line in that logic. However, half of that line was memory, and a significant portion of that memory went to Korean factories inside China.
References
- “Reclaiming the #1 Spot in Korea's Exports to China and Its Implications”
- “Exports to China Escape the ‘Deficit Swamp’… Overtaking Taiwan for #1 in 7 Years, ‘Resolving Mid-to-Long Term Risks’”
- “‘Semiconductors Account for Half of Exports’… $71.4 Billion by September 20th, ‘An All-Time High’”
- “Changes and Outlook for Korea's Trade Structure with China”