
U.S. National Debt of $40 trillion is not the result of a single mistake, but the accumulation of five overlapping factors. Since 2001, tax cuts, increased spending, and two major crisis responses have ballooned the debt, and we have now entered a phase where aging-related mandatory spending and interest costs are driving the debt up on their own.
Figures based on data as of September 2026 · Assumed exchange rate: $1 = 1,400 KRW
How much is $40 trillion in Korean Won? After crunching the numbers, it comes to 56 quadrillion KRW. It’s the first time I’ve used the unit ‘gyeong’ (10 quadrillion) outside of reading the news.
What’s even stranger is that while this massive debt has been accumulating, the U.S. hasn’t collapsed, nor has anyone been held significantly accountable. So, where did this debt actually come from? Following the numbers from the non-partisan fiscal watchdog CRFB and the Congressional Budget Office (CBO), the answer splits into five paths.
Cause 1. Tax cuts are the largest contributor to U.S. national debt
Since 2001, the largest chunk of the growing U.S. debt has come from tax cuts.
CRFB’s ‘From Riches to Rags’ update analysis calculates that five tax laws—the 2001 and 2003 Bush tax cuts, their extensions and modifications in 2010 and 2013, and the 2017 Trump tax cuts (TCJA)—increased the debt by over $8 trillion between 2001 and 2023. This is equivalent to 37% of GDP.
Once tax cuts are passed, they rarely go away. Extensions are repeated whenever they are set to expire, and the 2025 OBBBA (One Big Beautiful Bill Act) follows that trend. [The CBO estimated that the tax cuts in this bill would increase the deficit by $4.7 trillion from 2026 to 2035](https://www.conference-board.org/research/CED-Newsletters-Alerts/CBO-releases-negative-fiscal-outlook-for-2026-2036). While there are projections that $3 trillion will be offset by increased tariff revenue, tariffs are a source of revenue that can vanish if policies change.
Cause 2. War and new welfare programs pushed the debt higher

The second portion stems from the government simply spending more money.
CRFB estimates that this expansion in spending accounts for 33% of GDP in debt.
Examples include the costs of the wars in Afghanistan and Iraq, and programs like Medicare Part D (prescription drug insurance) established in 2003. Programs started without funding automatically accrue costs every year. While they may seem small in a single year’s budget, over 20 years, they accumulate to a scale similar to the tax cuts.
Cause 3. Financial crisis and COVID-19 response: relying on government bonds in every crisis
The third cause is the debt the government took on to stop the economy from collapsing during crises.
The response to the 2008 financial crisis and COVID-19 left behind over $6 trillion in debt, or about 28% of GDP, between 2001 and 2023.
The largest portion came during COVID-19. According to the Tax Policy Center, pandemic fiscal responses, combining tax cuts and spending, totaled about $5.6 trillion, and the federal debt-to-GDP ratio jumped from 79% in 2019 to 97% in 2022.
One sentence from the CRFB here was striking:
If even one of these—tax cuts, spending, or crisis responses—hadn’t happened, the debt would be near 2001 levels, and if none of them had occurred, we would have paid it all off by now. This implies that the cause of the debt isn’t tied to one party or one event.
Cause 4. Aging population drives debt through Social Security and Medicare spending
While the first three were past choices, the fourth is a debt that grows automatically.
As the baby boomer generation retires, spending on Social Security and Medicare increases automatically by law.
Looking at the CBO 2026–2036 outlook, Social Security spending is set to rise from 5.2% to 5.9% of GDP, and Medicare from 4.0% to 5.2%. This is an increase that happens even if Congress passes no new laws.
Why is this tricky? Because cutting this money would impact the retirement plans of tens of millions of people. It’s a territory difficult to touch without risking votes, so while past administrations have adjusted taxes or defense spending, they have steered clear of this. Fortune described this structure by saying, “Boomers voted the next generation a $40 trillion debt.”
Cause 5. We have entered a stage where U.S. Treasury interest begets interest
The final reason is the most frightening.
As the debt grows and interest rates rise, the interest itself has become a source of new debt.
The CBO expects net interest costs to double from $1 trillion in 2026 to $2.1 trillion in 2036. That is an increase from 3.3% to 4.6% of GDP, a steeper climb than the increase in Medicare over the same period. Interest spending has already surpassed defense spending.
Interest is money that creates nothing new. It’s not for roads or pensions; it’s the cost of past debt. But because they print more government bonds to cover this, the higher the interest rates, the more the debt feeds on itself. The reason the dollar weakened after the Treasury tried to buy back long-term bonds to suppress rates /posts/buyback/ is also tied to this vicious cycle.
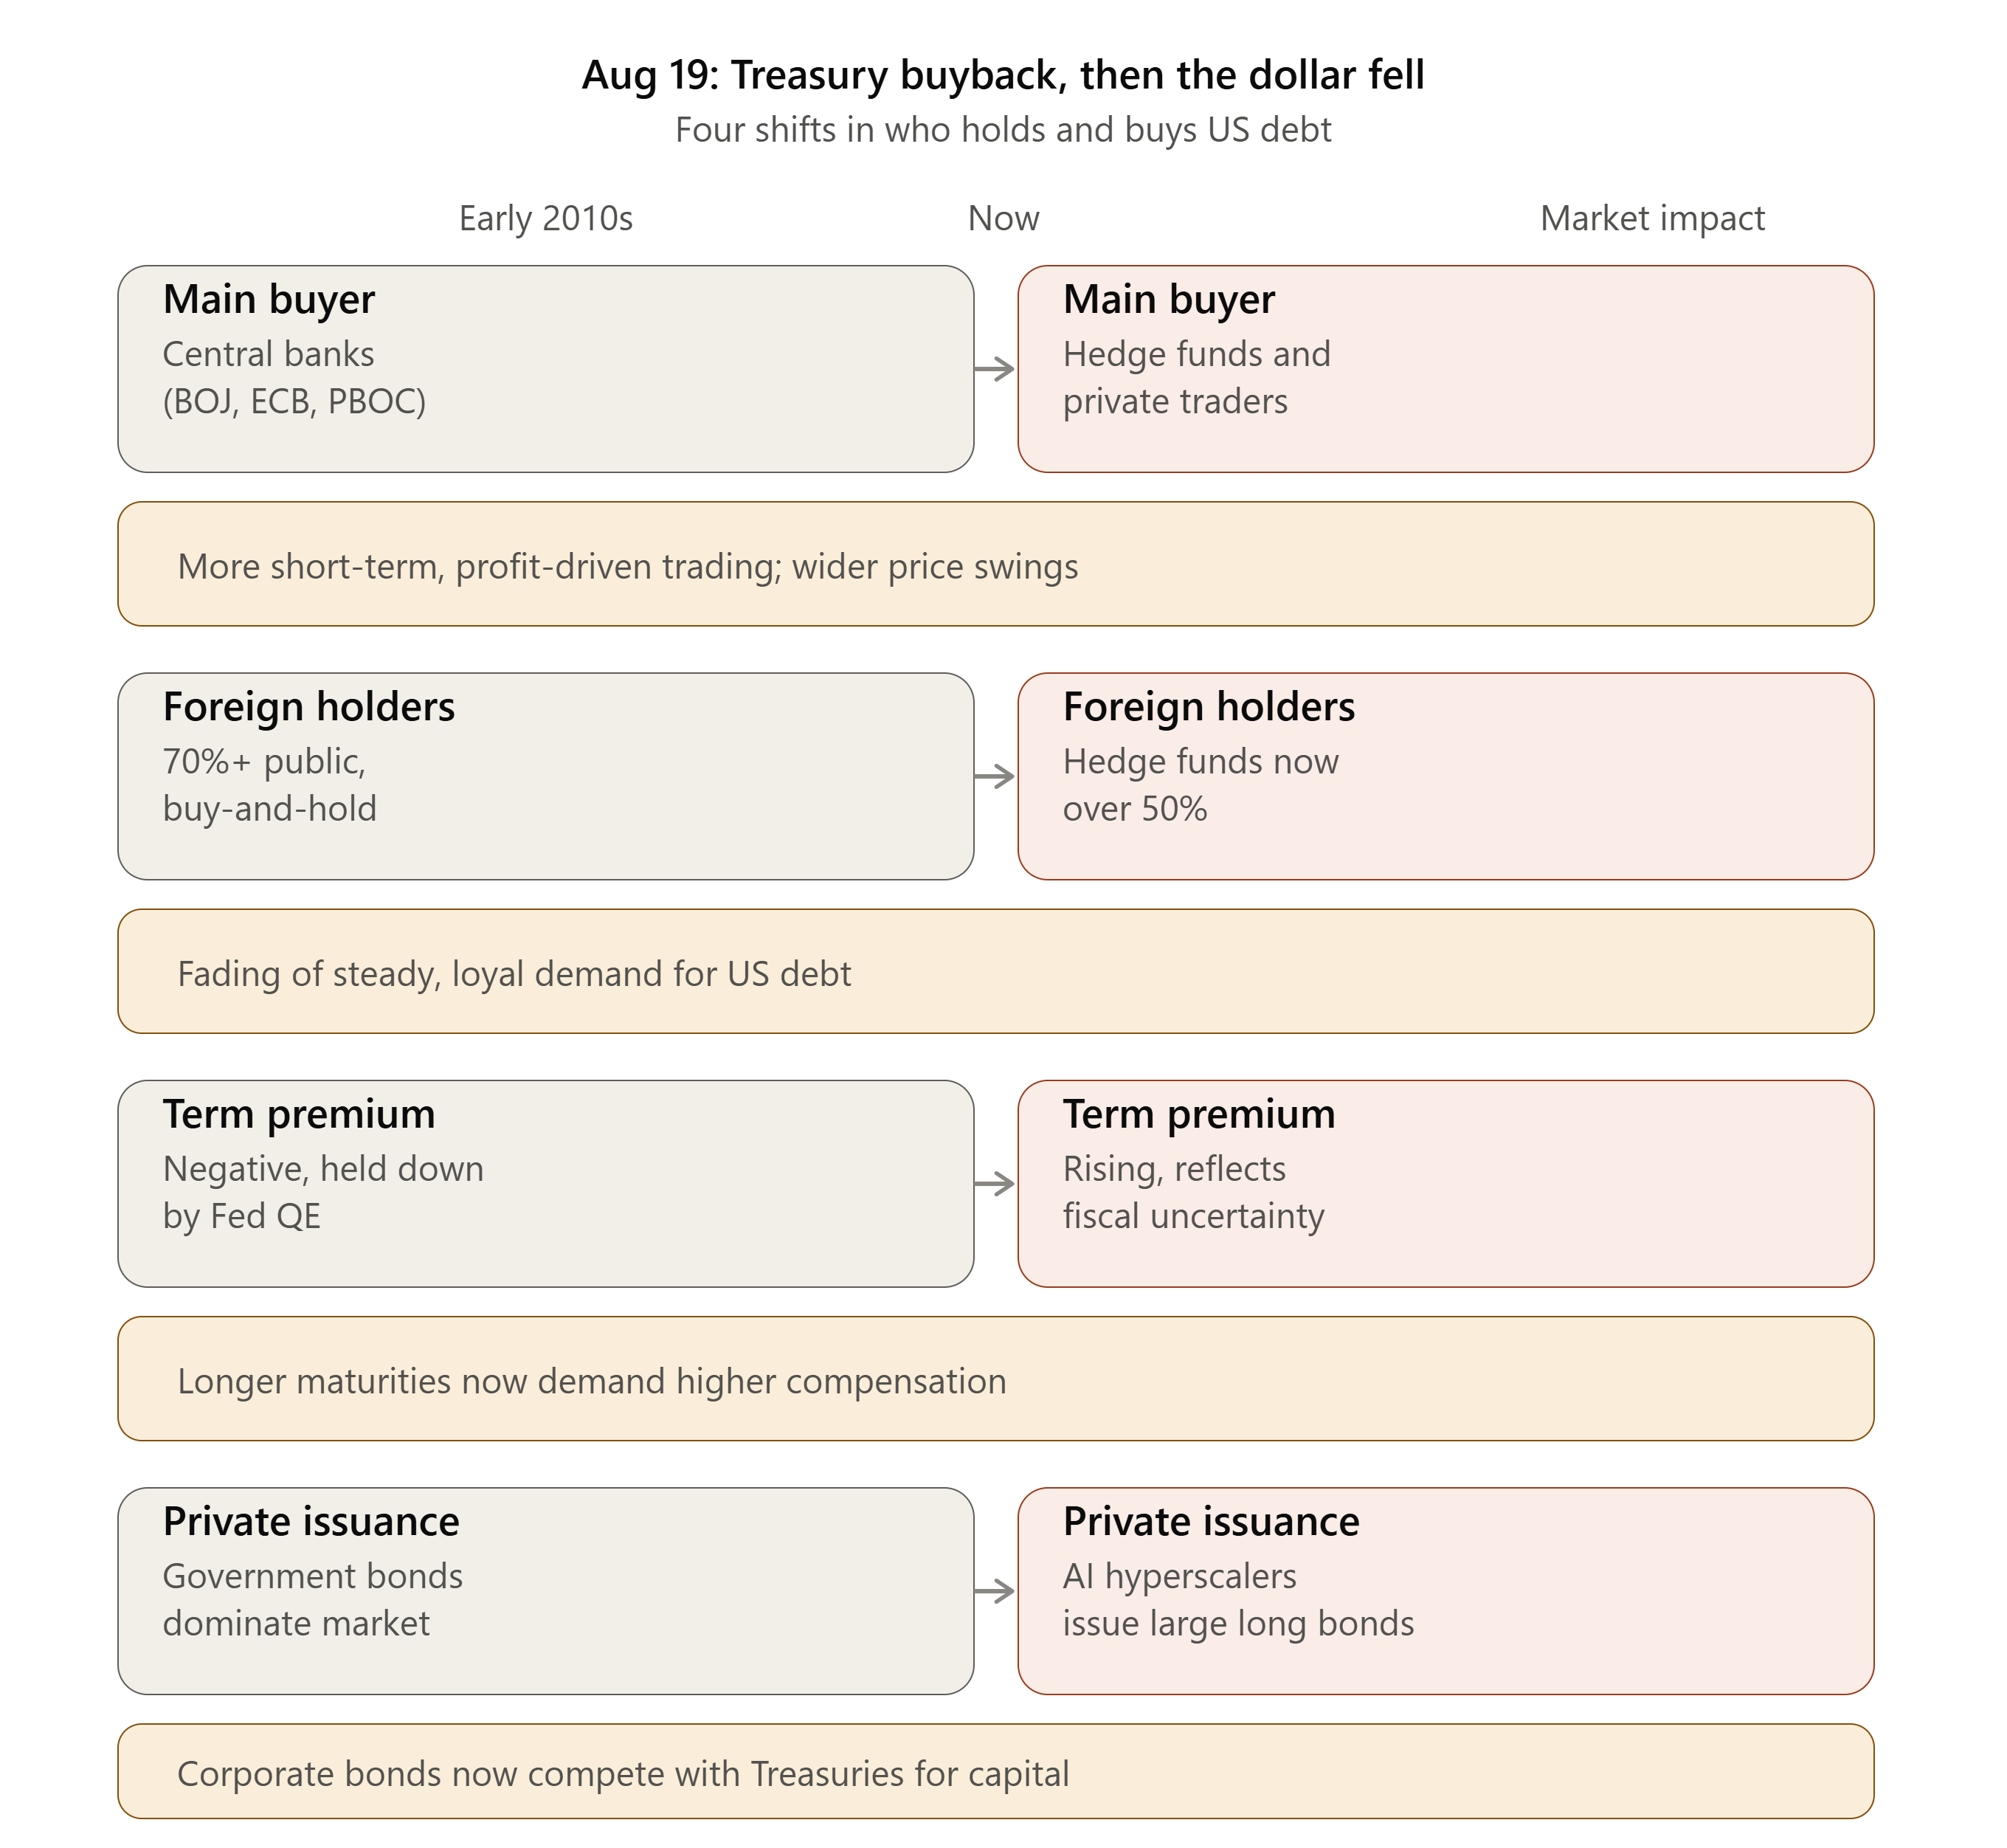
Treasury bond issuance is increasing, but the number of buyers is decreasing
A Quick Overview of the 5 Causes of U.S. National Debt
The table below summarizes the scale and nature of the U.S. national debt by cause.
| Cause | Scale (Source) | Nature |
|---|---|---|
| Tax Cuts | $8 trillion+ (2001-2023), 37%p of GDP (CRFB) | Past choice, repeated extensions |
| Increased Spending | 33%p of GDP (CRFB) | Past choice, cumulative |
| Crisis Response | $6 trillion+, 28%p of GDP (CRFB) | Unavoidable emergency spending |
| Aging Mandatory Spending | Social Security 5.2→5.9%, Medicare 4.0→5.2% of GDP (CBO) | Automatic increase |
| Interest Costs | $1 trillion → $2.1 trillion, 2026→2036 (CBO) | Self-compounding |
The first three are debts already accumulated, while the latter two are debts that grow even if we do nothing. The reason the CBO projects a 2036 deficit of $3.1 trillion, or 6.7% of GDP, is because of the bottom two rows.
Who will eventually pay off the U.S. national debt?
It’s less about who pays it off, and more about how the burden is shared.
If taxes are raised, taxpayers bear the cost; if spending is cut, beneficiaries feel it; if prices rise, everyone holding dollars pays a little bit. It hasn’t been decided yet which path the U.S. government will take. However, now that interest has surpassed defense spending, the numbers confirm that the longer the choice is delayed, the higher the cost will be. This is why the third path—eroding the real value of debt through inflation—keeps being brought up.
Notice: This article is based on publicly available information at the time of writing and is not a recommendation for any specific investment or financial product. Figures and policies may change in the future.
References
- Committee for a Responsible Federal Budget, How Debt Got to 100% of GDP: A From Riches to Rags Update
- CBO, The Budget and Economic Outlook: 2026 to 2036
- CBO, Testimony on The Budget and Economic Outlook: 2026 to 2036
- Conference Board, CBO Releases Negative Fiscal Outlook for 2026-2036
- Tax Policy Center, How did the fiscal response to the COVID-19 pandemic affect the federal budget outlook?
- U.S. Treasury Fiscal Data, Understanding the National Debt
- Fortune, How Boomers voted the next generation a $40 trillion debt (2026-09-09)
- U.S. National Debt Hits $40 Trillion for the First Time... Interest Burden Rises Due to High Rates