
‘Where do we stand in the era of ‘Irrational Exuberance’?
In 2025, the U.S. stock market, backed by the AI revolution, seems poised for endless growth. Amidst the heated debate over the asset market bubble, is this phenomenon the dawn of a new era, or just another instance of ‘irrational exuberance’? To answer this question, we delve into the current market using the behavioral economics framework of Nobel laureate Robert Shiller, who predicted the dot-com bubble and the housing market collapse, seeking wise investment directions.
How is an Asset Market Bubble Created? (Robert Shiller’s Theory)
To diagnose an asset market bubble, we first need a clear theoretical framework regarding what a bubble is and how it forms and sustains itself. Professor Robert Shiller’s research presents the psychological factors that traditional economics often overlooks as key variables in asset pricing.
Is the Market Always Rational?: A Challenge to the Efficient Market Hypothesis
Traditional financial theory is based on the ‘solid foundation theory’, which posits that every asset has an ‘intrinsic value’ and that market prices will eventually revert to this value. This evolved into the ‘Efficient Market Hypothesis (EMH)’, which states that all information is immediately reflected in prices, preventing anyone from earning excess returns.
However, Professor Shiller challenged this hypothesis in a 1981 paper by demonstrating ’excess volatility’, where actual stock price volatility could not be explained solely by future dividend volatility. He observed that investors focus more on ‘what other investors will pay in the future’ rather than the intrinsic value of assets. This aligns with the ‘castle in the air theory’, where asset value is built on the psychology of the masses, marking the beginning of behavioral economic analysis.
The Engine of Irrational Exuberance: Feedback Loops and Social Contagion
In his book ‘Irrational Exuberance’, Shiller presents the ‘Feedback Loop’ mechanism as the core engine of speculative bubbles.
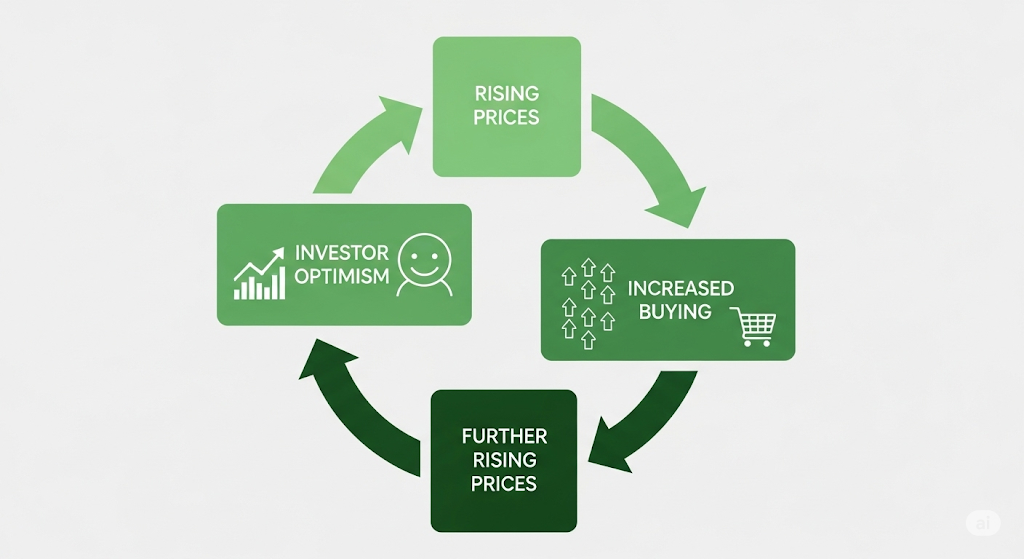
- Trigger Factors: Technological innovations (e.g., the internet) or policy changes (e.g., interest rate cuts) lead to initial price increases.
- Price Increase and Influx of Investors: News of rising prices spreads, and new investors enter the market with expectations of further increases.
- Psychological Contagion: Hearing stories of successful individuals, investors join in due to fear of missing out (FOMO) and jealousy.
- Self-Reinforcing Cycle: New purchases push prices higher, reinforcing the belief that initial investments were correct, attracting even more investors.
These feedback loops are further amplified by cognitive biases such as confirmation bias, herd behavior, and overconfidence.

The Power of Narratives that Move Markets: Narrative Economics
Professor Shiller argues that economic events are greatly influenced by popular ’narratives’ that spread like a virus. During speculative bubble periods, narratives like “this time is different” emerge to justify high prices. The ’new economy’ narrative during the dot-com bubble is a prime example. The media plays a crucial amplifying role in these narratives, accelerating the social contagion of bubbles.

Tools for Measuring Bubbles: CAPE Ratio and Investor Confidence Index
Shiller’s theory is further strengthened by the specific measurement tools it presents.
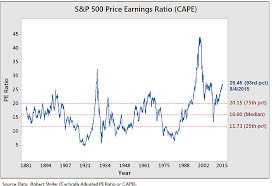
- Cyclically Adjusted Price-to-Earnings Ratio (CAPE Ratio): Also known as ‘Shiller P/E’, this is the current price divided by the inflation-adjusted average earnings over the past 10 years. It is a reliable indicator reflecting a company’s long-term profitability and diagnosing market overvaluation. Historically, higher CAPE ratios have correlated with lower future real stock market returns.
- Investor Confidence Index: The Valuation Confidence Index decreases when more investors perceive the market as overvalued, while the Crash Confidence Index reflects the proportion of investors who see a low likelihood of market collapse. A low value in this index indicates high investor anxiety.
Reflections from the Past: The Dot-Com Bubble and the 2008 Financial Crisis
We can observe how Shiller’s framework operates in reality through notable past asset bubble cases.
Case 1: Dot-Com Bubble (1995-2001) - The Conclusion of the ‘New Economy’ Narrative
The dot-com bubble at the end of the 20th century is a textbook example of Shiller’s theory. The emergence of commercial internet was the trigger factor, and the powerful narrative of ‘New Economy’ dominated the market. This narrative spread the belief that traditional valuation methods were meaningless, leading individual investors, gripped by FOMO, to dive into the market and form a typical feedback loop. At that time, Shiller warned that the CAPE ratio had reached levels seen just before the Great Depression in 1929, and ultimately, the bubble burst in March 2000, causing the Nasdaq index to plummet by nearly 80%.
Case 2: U.S. Housing Market Bubble - The Collapse of the ‘Real Estate Never Fails’ Myth
After the dot-com bubble burst, speculative frenzy shifted to the housing market. The myth that “housing prices never fall” dominated the market, creating a feedback loop where rising prices generated more demand. Shiller’s ‘Case-Shiller Home Price Index’ clearly illustrated the housing price surge, and he warned of a market collapse starting in 2005. This warning became reality with the 2008 global financial crisis.
Diagnosing the 2025 Asset Market Bubble: U.S. vs. Korea
As an investor, I often feel FOMO, wondering if I am falling behind. What emotions do you feel when looking at the current market? Investment decisions are influenced not only by rational analysis but also by powerful psychological factors. Let’s diagnose the current market in 2025 through the mirror of the past.
U.S. Market: An AI Revolution or a Second Dot-Com Bubble?
- Valuation (Quantitative Signals): As of July 2025, the CAPE ratio of the S&P 500 index stands at 37.81. This is more than double the historical average (around 17) and is an extremely high level observed only just before the Great Depression in 1929 and the dot-com bubble burst in 2000.
| Market Peak | Highest CAPE Ratio | Subsequent 10-Year Real Annual Return |
|---|---|---|
| September 1929 | 32.6 | Negative (-) |
| March 2000 (Dot-Com Bubble) | 44.2 | Negative (-) |
| July 2025 | 37.81 | Future Estimate |
- Narrative Analysis (Qualitative Signals): The dominant narrative justifying the current market is undoubtedly the ‘AI Revolution’. While similar to the ‘New Economy’ narrative of the dot-com bubble, a key difference is that current AI-led companies are actually generating substantial profits.
| Comparison Item | Dot-Com Bubble (1999) | AI Boom (2025) |
|---|---|---|
| Core Narrative | ‘New Economy’ - The internet changes everything. | ‘AI Revolution’ - AI changes everything. |
| Market Leaders | Numerous unprofitable dot-com startups | A few big tech companies with massive profits |
| Profitability Status | “Profits are a later issue; traffic is king.” | Actual profits and cash flow generation |
Nonetheless, the AI narrative may be layered over a solid reality with irrational expectations, creating a massive ‘castle in the air’.
- Investor Sentiment Analysis: The ‘Valuation Confidence Index’ is historically very low, indicating that most investors perceive the market as expensive. Simultaneously, the ‘Crash Confidence Index’ is also low, reflecting widespread anxiety about a market collapse. This can be seen as a state of ‘fearful participation’, where investors, aware of market risks, are drawn in by the fear of missing out on the AI revolution.
Korean Market: Chronic Undervaluation and the New Narrative of ‘Value-Up’
The KOSPI market in Korea shows a starkly opposite picture to that of the U.S. It has suffered from chronic undervaluation, known as the ‘Korea Discount’. As of June 2025, the estimated CAPE ratio of the KOSPI is 15.76, significantly lower than the U.S. and other major countries.
| Country | Representative Index | CAPE Ratio (June 2025) |
|---|---|---|
| U.S. | S&P 500 | 32.87 |
| India | NIFTY 50 | 35.76 |
| Japan | Nikkei 225 | 24.99 |
| Korea | KOSPI | 15.76 |
| China | SSE Composite | 15.41 |
- Narrative Analysis: If the past narrative dominating the Korean market was the ‘Korea Discount’, a new narrative of ‘Corporate Value-Up Program’ led by the government has emerged since 2024. This narrative raises expectations that it will address structural issues in Korean companies and enhance shareholder value, serving as a key driver of recent market rises. Therefore, the current movements in the Korean market can be interpreted as a ‘hopeful revaluation’ process based on expectations of fundamental improvements rather than irrational exuberance.
A Quick Comparison of the 2025 U.S. vs. Korean Markets
| Feature | U.S. Stock Market | Korean Stock Market |
|---|---|---|
| Core Narrative | AI Revolution (Expectations of New Technology) | Corporate Value-Up (Expectations of Structural Reform) |
| Valuation (CAPE) | Historical Highs (Bubble Concerns) | Undervalued Compared to Major Countries |
| Investor Sentiment | Fearful Participation (FOMO) | Hopeful Revaluation |
| Core Risks | Possibility of Asset Market Bubble Collapse | Possibility of Reform Failure |
Conclusion: How to Survive in an Irrational Market
The analysis of the 2025 market through Robert Shiller’s framework shows a clear contrast. Based on this diagnosis, here are a few strategies for wise investors.
-
Key Points Summary
- The U.S. market shows clear signs of a bubble. The high CAPE ratio and ‘AI revolution’ narrative are similar to past bubbles, posing a significant risk of long-term return decline.
- The Korean market is closer to opportunity than a bubble. It is at a stage where a positive narrative of ‘value-up’ is emerging from a structurally undervalued state.
- What moves the market are psychology and narratives. Understanding the narratives dominating the market and investor psychology is crucial, beyond fundamental analysis.
-
Next Action Suggestion (CTA) It is important to maintain a long-term perspective without getting swept up in the irrational exuberance of the market. Why not check if your portfolio is overly concentrated in a specific narrative based on objective indicators like the CAPE ratio? Remember, prices are not just numbers; they are the results of intertwined human hopes, fears, and stories.
References
- JoongAng Ilbo [Jo Won-kyung’s ‘The Subtle Scent of a Nobel Laureate in Economics’ (18)] Stopping to See the Bubble and Fear](https://jmagazine.joins.com/economist/view/312231)
- SoBrief Irrational Exuberance | Summary, Quotes, FAQ, Audio
- Quartz Robert Shiller wrote the book on bubbles. He says “the best example right now is bitcoin.”
- Harry Research The Ongoing Debate on the Efficient Market Hypothesis Through the Nobel Prize in Economics
- CFA Institute Robert J. Shiller on Bubbles, Reflexivity, and Narrative Economics
- SisaIN [‘The Power of Narratives’ Impact on the Stock Market [Capital Market Story]
- Shiller Data Online Data Robert J. Shiller
- Investopedia CAPE Ratio (Shiller P/E Ratio): Definition, Formula, Uses, and…
- Yale School of Management United States Stock Market Confidence Indices
- J.P. Morgan Asset Management AI investment trends 2025: Beyond the bubble
- Siblis Research CAPE Ratios by Country (Global Shiller PE Ratios)