

The last 10 minutes are everything.
Every day at 3:50 PM, a strange phenomenon unfolds at the New York Stock Exchange.
A market that dozed for six hours suddenly jolts awake. Orders flood in, volume surges, and prices shift dramatically.
In developed European markets, 35% of total daily trading volume is processed in this single closing auction session. In the US, it is 15%.
Just a decade ago, these numbers were unthinkable.
This concentration wasn’t created by algorithms. Nor is it the manipulation of hedge funds.
It is index funds.
To be more precise: the philosophy of not trying to beat the market has fundamentally transformed the structure of the market itself.
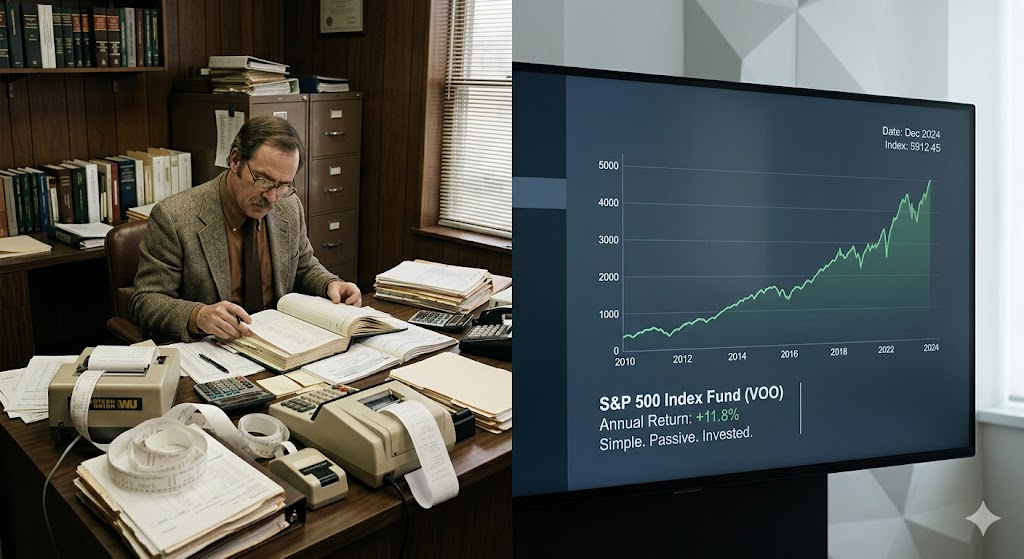
Passive investing entered the world in 1976.
When a man named John Bogle launched the first index mutual fund for individual investors through Vanguard, Wall Street’s response was pure cynicism.
It was dismissed as “Bogle’s Folly.” Critics asked what kind of real investing merely copies the market.
Fifty years have passed since then. In 2024, assets under management in passive funds surpassed active funds for the first time.
Three firms—BlackRock, Vanguard, and State Street—now hold more than 20% of the market capitalization of US publicly traded companies and exercise 25% of the voting shares at shareholder meetings.
Across 88% of S&P 500 companies, these three firms together are the single largest shareholder.
The idea once mocked as foolish is now rewriting the very corporate governance of capitalism.
This article is not about how great passive investing is. That has already been proven by the numbers.
This article is about what happens when that greatness grows too large.
1. The Logic of the Revolution Was Flawless
First, we need to understand why passive investing won. Because that very reason is the root of today’s paradox.
In 1965, Eugene Fama of the University of Chicago asked an unusual question:
“If experts cannot beat the market, what does that mean?” His answer was near-provocative.
Market prices already reflect all available information. Therefore, any attempt to generate excess returns by analyzing that information cannot, in principle, be sustained.
-> This is the Efficient Market Hypothesis.
Paul Samuelson applied this theory to real-world practice.
In 1974, after analyzing the track records of investment professionals, he stated bluntly:
“Someone, somewhere, should set up an in-tandem mutual fund that aims to replicate the S&P 500. It will beat most active funds.”
Bogle listened. Two years later, Vanguard’s first index fund was born.
Decades of data accumulated since. And the data was ruthless.
The SPIVA Scorecard, published annually by S&P Dow Jones Indices, delivers the same conclusion over and over.
Over a 10-year horizon, 84% of US large-cap active funds fail to beat the S&P 500 index.
For international equities, it is 85%; for emerging markets, 87%. The longer the timeframe, the worse the numbers get.
The reason can be explained with simple arithmetic.
The sum of all investors’ returns equals the market return.
Active funds charge fees on top of this. Therefore, after deducting fees, the average active dollar must underperform the average passive dollar. This is not a statistical tendency—it is a mathematical certainty.
William Sharpe proved this in a 1991 paper.
The paper’s title was just four words: “The Arithmetic of Active Management.”
Costs decide everything.
Following consecutive fee cuts in 2025 and 2026 by Vanguard, expense ratios for major index funds sit around 0.03% to 0.06% per year.
Active funds holding the same underlying assets charge an average of 0.39%.
Over a 20-year horizon on a $100,000 portfolio, this gap alone translates into tens of thousands of dollars in difference.
For individual investors, passive investing was a revolution.
No complex analysis, no brilliant intuition, no luck required. Just buy the index. You will outperform 80% of the professionals.
This is a fact. And this very fact is now creating an entirely new problem.
2. Liquidity Clusters into the Final 10 Minutes
Let’s step back for a moment.
Imagine you are an index fund manager. Your mandate is simple.
Replicate the S&P 500 index as precisely as possible. Keeping the gap with the index—the tracking error—as close to zero as possible is your primary performance metric.
So when should you buy and sell stocks?
There is only one answer. You must trade at the exact moment the index calculates its closing price: at the close.
If you buy at 10:00 AM, a gap emerges between your purchase price and that afternoon’s closing price.
That gap is tracking error. For a passive fund, tracking error is failure.
Therefore, passive managers trade in the Market-on-Close (MOC) auction. Always.
The problem is that passive funds are not the only ones thinking this way.
As passive assets grow, volume right before the close increases.
-> As volume increases, liquidity in the closing auction improves.
-> As liquidity improves, other investors start shifting their trading to the close as well.
-> This pushes closing auction volume even higher.
Economists call this “liquidity begets liquidity.”
It sounds like a virtuous feedback loop. In reality, it is not.
When we say that 35% of daily volume in developed European markets is concentrated in a single closing auction session, reading it from the opposite side yields this: “Liquidity during the preceding six trading hours is being hollowed out.”
Anyone who actively trades stocks has likely felt the real-world consequence of this phenomenon.
Placing an order in the morning reveals wider bid-ask spreads. Order books are thin. A single medium-sized order moves the market price.
-> Capital markets researchers are increasingly concluding that this is not an occasional intraday anomaly, but a structural trend.
This is the decay of the price discovery function.
In the past, the closing auction aggregated the outcomes of decisions made throughout the day by participants using their own analysis and judgment.
Today’s closing auction is different.
Passive funds and the capital tied to them generate brute supply-and-demand pressure asserting that “the index must close right here today.”
Prices are set purely by the mechanical force of index-tracking capital, decoupled from any real-time changes in corporate intrinsic value.
There are even more extreme moments.
Namely, the quarterly index reconstitution days.
Passive funds must simultaneously dump all securities being removed from an index and simultaneously buy every newly added security.
On these days, the prices of affected stocks swing by several percentage points for reasons having nothing to do with the underlying business.
Forced to trade at these distorted prices, the actual returns realized by passive funds fall below the theoretical index performance shown in backtests.
This is the first paradox of passive investing:
The individual pursuit of minimizing tracking error collectively manufactures tracking error.
3. Those Who Move the Market vs. Those Who Make the Market

What does the expansion of passive investing actually mean?
Technically, it’s straightforward: more capital moves purely along with index weights.
It buys stocks simply because they are in the index, without analyzing financial statements or future outlooks. And it never sells as long as the stock remains in the index.
What happens when this capital grows large enough?
Researchers at Harvard and the University of Chicago proposed the “Inelastic Markets Hypothesis.”
The central thesis is that the equity market’s demand curve is far more inelastic than traditionally assumed. -> Even small mechanical capital inflows can push stock prices well outside fundamental values.
Passive capital is the single largest form of such mechanical inflows.
There are precise figures to support this.
When passive ownership of a stock increases by one standard deviation, the probability of an extreme positive price spike increases by 19.4 percentage points, and the probability of an extreme crash increases by 19.2 percentage points.
Considering that the historical baseline tail risk for standard large-cap stocks is around 23% to 26%,
this means that passive ownership alone has become a dominant variable explaining a significant portion of stock price volatility.
This manifests invisibly in another metric: stock-to-stock correlation.
From 1962 to 1997, the average pairwise correlation among US stocks was 5.7%.
That was the probability of Stock A and Stock B moving in tandem.
From 1998 to 2020, after passive investing went mainstream, that number surged to 13.4%—more than double.
Why is this a problem?
The logic of diversification rests entirely on low correlation.
Holding uncorrelated assets means when one falls, another cushions the blow.
However, when massive inflows or outflows hit passive index funds, every component stock rises and falls together without any fundamental catalyst.
Consequently, even if an investor holds every single stock in the index, true diversification is diminished. -> Because passive investing itself elevates market-wide correlation.
Yet this issue extends far beyond individual portfolio volatility.
The core function of capital markets is resource allocation.
Capital should flow to productive businesses and withdraw from unprofitable ones—a mechanism that requires investors to analyze firms and reflect those insights in stock prices.
As passive capital dominates, the proportion of active market participants conducting research shrinks.
When a company reports outstanding earnings, it gets sold if it drops from an index.
When a company reports disastrous results, it gets bought continuously as long as it sits in an index.
The capacity of prices to communicate the underlying value of a business—its price discovery function—is degraded.
This is not mere academic concern; it is a measured reality.
Quantitative studies have confirmed that stocks with higher passive ownership exhibit slower incorporation of firm-specific information into their share prices, with temporary noise accounting for a greater share of price variance.
4. Why Winning Five Times in a Row Means Nothing
At this point, one might argue:
Isn’t passive still better than active?
Even if the market structure distorts, isn’t capturing the market average without paying fees the best choice for an individual investor?
This counterargument is valid. At the same time, it is incomplete.
SPIVA data is calculated on an equal-weighted basis. It assigns the same weight to every fund.
In the real world, however, nobody allocates identical capital across all funds. Capital naturally concentrates in top-performing managers.
Recalculating performance on an asset-weighted basis alters the picture dramatically.
This is especially true in the fixed-income market.
On an equal-weighted basis, 54% of US high-yield bond active managers fail to beat their benchmark over a 5-year period.
On an asset-weighted basis, however, 86% of assets in this category outperformed the benchmark.
What does this show?
A small cohort of premier, large-scale active bond funds genuinely generates significant alpha.
The bond market operates differently from equity markets: over-the-counter negotiations, private credit, fragmented liquidity. There is ample room for institutional active managers with scale and networks to establish tangible advantages.
There is an even more important point.
SPIVA does not measure how inherently “smart” passive investing is.
Passive return is simply the market return itself.
The average active fund lags the market return not because 80% of managers are incompetent, but because of the fee drag.
Strip out or reduce the fees, and the distribution of active performance shifts meaningfully.
In 2024, there was a quarter where the top five mega-cap stocks in the S&P 500 generated 94% of the entire index’s return.
What were active managers supposed to do in that environment?
Regulatory diversification mandates made it virtually impossible to hold Nvidia or Apple at their exact index weights. Naturally, they lagged.
This was not a failure of active skill, but the outcome of a structural distortion caused by extreme mega-cap concentration.
And that concentration is inextricably linked to the massive expansion of passive investing itself.
5. Three Companies Vote for the World

When fees converge, capital converges.
Passive funds track the exact same indices using the exact same strategies. The only differentiator is cost.
Capital flowing to the lowest-cost provider is an inevitable economic outcome.
The result of that convergence: BlackRock, Vanguard, and State Street (the “Big Three”) command over 90% of US passive equity fund assets.
The combined assets under management of these three firms exceed $24 trillion—a figure approaching 90% of US GDP.
To understand what this number truly means, consider shareholder voting.
The Big Three represent the single largest shareholder in 88% of S&P 500 companies. Together, they cast roughly 25% of all shareholder votes across US publicly traded corporations.
No government in history has ever wielded this degree of corporate shareholder concentration.
In classical shareholder capitalism theory, the lead shareholder monitors and disciplines corporate executives.
They run proxy contests to replace ineffective management.
If the stock persistently underperforms, they sell their shares or apply direct pressure to the board.
-> The Big Three can do practically none of this.
A passive fund cannot sell a stock unless the underlying index excludes it.
There is no “exit strategy.” Consequently, they have surrendered one of the most powerful mechanisms for holding management accountable from day one.
At the same time, the cost of actively exercising governance is not shared by competing asset managers.
If one firm spends resources running a governance campaign that successfully raises corporate value, those gains are shared equally across every other passive fund replicating that index.
This creates a classic free-rider problem.
Without an economic incentive, the rational choice is to avoid in-depth, costly corporate monitoring.
Yet labeling the Big Three’s behavior as simple neglect would be inaccurate.
They operate dedicated, large-scale stewardship teams.
The strategy they have chosen is not public proxy battles, but “quiet engagement.”
They meet with management behind closed doors prior to annual meetings to convey expectations. Management routinely accommodates these requests in advance to avoid a public vote showdown.
As a result, public conflicts are rare. But that does not mean oversight is thriving.
Rather, it means three asset management giants are quietly steering the governance direction of thousands of corporations in unison.
The 2017 Procter & Gamble shareholder meeting demonstrated the magnitude of this power.
Over activist investor Nelson Peltz’s bid for a board seat, BlackRock and State Street voted in favor, while Vanguard voted against.
The split among the three decided the outcome, which came down to a razor-thin margin of just a few million shares.
The voting direction of three firms directly altered the board composition of a global conglomerate.
This is a new form of power.
It is unelected, lightly regulated, and lacks any clear mechanism for dissolution.
Passive investors entrust their capital to these firms, which then leverage that capital to shape corporate governance.
Yet those individual investors have almost no visibility into how their voting rights are exercised.
6. Inside Korea’s 300 Trillion Won ETF Market
This dynamic is playing out in South Korea as well.
In fact, the Korean market displays an even more extreme manifestation in several respects.
By October 2025, total net assets in the domestic ETF market surpassed 250 trillion KRW, reaching 297 trillion KRW by late December. -> That represents more than a fourfold expansion compared to five years prior.
Furthermore, the number of registered ETF products in the domestic market stands at over 451, by far the highest in Asia.
Reading the “451 products” figure from a structural perspective reveals a critical issue.
Investor capital is severely fragmented. KODEX 200 and TIGER 200 replicate the exact same KOSPI 200 index.
The primary differentiators are minor fee variances and brand recognition. Yet nearly every asset manager launches its own version.
This fragmentation translates into diluted liquidity.
When capital is split across multiple products replicating identical indices, individual product liquidity declines and spreads widen.
Investors end up paying higher transaction costs to purchase the exact same basket of stocks.
There is an even more fundamental issue.
A substantial portion of capital entering Korean ETFs originates from pension accounts.
The structural inflow of retirement pensions and individual pension savings into ETFs has solidified alongside tax incentives.
This capital has a distinct profile: it is not pursuing short-term trading gains, but is designated for retirement decades down the road.
What does it mean for this long-term capital to flow indiscriminately into market-cap-weighted index ETFs?
In the Korean KOSPI index, Samsung Electronics alone accounts for an immense double-digit percentage weighting.
Buying KODEX 200 is effectively equivalent to purchasing a massive single-stock position in Samsung Electronics alongside fractional holdings of everything else.
It appears to be diversified investing, but in reality, it is concentrated single-asset exposure.
The inverse problem applies to global ETFs. Purchasing an S&P 500 ETF allocates nearly 30% of total capital across just seven US mega-cap tech stocks.
In 2024, these few stocks generated the vast majority of the index’s return. If they stall, the entire index bears the full brunt of the downside.
What looks like diversification without actually being diversified—this is the reality of the modern passive ETF.
7. The Next Revolution Will Arrive More Quietly

A potential alternative is increasingly presented to address these challenges:
Direct Indexing.
The concept is simple.
Instead of buying a pooled ETF, an investor directly holds the hundreds of individual underlying stocks within their own account, with software algorithms handling automatic rebalancing. Fractional share trading makes this feasible even with modest capital.
What differentiates this from a standard ETF is customizability.
Investors can exclude specific sectors, adjust factor weightings, or apply personalized ESG criteria. Above all, tax strategies can be optimized around individual tax situations.
Major US asset managers are already competing aggressively to capture the direct indexing market.
BlackRock acquired Aperio, and Vanguard acquired Just Invest.
In South Korea, as fractional trading becomes standard and pension account balances grow, demand in this direction is steadily building.
Does direct indexing resolve the systemic issues outlined earlier?
Only partially.
It does not solve market-wide co-movement. If portfolios remain anchored to the same underlying market cap benchmarks, liquidity concentration and weakened price discovery will persist.
However, for individual investors, it represents a meaningful evolution.
Particularly regarding tax optimization (Tax-Loss Harvesting):
While the ETF vehicle offers tax deferral benefits, it is managed at the fund level. Direct indexing enables tax management at the individual account level, allowing targeted harvesting of realized gains and losses.
The voting rights dynamic is also distinct. Because shares are owned directly, investors retain the theoretical ability to cast their own proxy votes.
Currently, direct indexing remains relatively expensive and operationally complex.
It is not yet easily accessible to everyday retail investors.
Yet as technology advances and software costs decline, it has the potential to become as mainstream over the next 5 to 10 years as ETFs are today.
Revolutions arrive quietly.
If the first revolution was “Buy the index,” the second revolution will be “Own the index your own way.”
8. Can the Market Digest the Revolution?
How can we address the concentration of liquidity into the closing auction?
One policy proposal is piloting a “Random End” mechanism for market close.
If market participants cannot predict the exact second the closing auction concludes, the incentive for passive funds to dump orders simultaneously decreases. This has been tested on several European exchanges.
How should voting power concentration be tackled?
Mandatory “pass-through voting” is under active discussion.
Under this model, passive funds must pass voting authority directly through to the underlying fund shareholders.
While it poses operational hurdles and often suffers from low retail participation, the regulatory direction is clear.
In South Korea, structural tax support to facilitate direct indexing warrants consideration, such as expanding capital gains netting provisions for individually held equities within retirement accounts.
However, for any policy reform to gain traction, there must first be widespread recognition that a structural issue exists.
And building that awareness is difficult.
Because the distortions of passive investing do not manifest with dramatic alarms.
Degraded price discovery does not trigger an overnight market collapse.
Liquidity clustering into the closing auction is not immediately obvious to retail investors checking daily prices.
The Big Three exercising corporate votes does not create a visible, immediate victim.
This is a slow-moving structural shift.
Like the gradual shifting of a riverbed. You do not notice the difference for years, until one day you realize the river flows somewhere entirely different.
Final Thoughts

Passive investing is sound.
That foundational statement remains true.
Minimizing fees,
matching the market return,
and holding for the long run remains one of the most rational decisions an individual investor can make.
-> Decades of empirical data confirm it.
Yet passive investing relies on an essential premise:
-> It assumes the market functions properly, that prices convey accurate information, and that corporate oversight remains operative.
That premise is being tested.
In a market where prices no longer efficiently incorporate corporate fundamentals, what exactly is passive investing replicating?
When an index is overwhelmingly driven by a handful of mega-caps regardless of broader business reality, what does following the “market average” actually mean?
There are no simple answers to these questions.
The benefits delivered by passive investing are real, enjoyed by hundreds of millions of investors worldwide.
At the same time, the structural distortions accumulated by passive dominance are equally real—and it remains uncertain who will ultimately bear the cost.
As individuals, we discovered an optimal strategy to navigate the market.
Yet when that strategy is adopted collectively, it transforms the nature of the market itself.
And where that altered market will ultimately lead us is something no one has yet witnessed to the end.
References
- Fama, E.F. (1970). “Efficient Capital Markets: A Review of Empirical Work.” Journal of Finance, 25(2), 383–417.
- Samuelson, P.A. (1974). “Challenge to Judgment.” Journal of Portfolio Management, 1(1), 17–19.
- Sharpe, W.F. (1991). “The Arithmetic of Active Management.” Financial Analysts Journal, 47(1), 7–9.
- S&P Dow Jones Indices. (2025). SPIVA U.S. Scorecard Year-End 2024. New York: S&P Global.
- BlackRock. (2017). Index Investing Supports Vibrant Capital Markets. BlackRock Investment Institute.
- Vanguard Group. (2026). Vanguard Announces Further Expense Ratio Reductions for 53 Funds. Press Release, February 1.
- Koijen, R.S.J., & Yogo, M. (2019). “A Demand System Approach to Asset Pricing.” Journal of Political Economy, 127(4), 1475–1515.
- Gabaix, X., & Koijen, R.S.J. (2021). “In Search of the Origins of Financial Fluctuations: The Inelastic Markets Hypothesis.” NBER Working Paper No. 28967.
- Appel, I., Gormley, T., & Keim, D. (2016). “Passive Investors, Not Passive Owners.” Journal of Financial Economics, 121(1), 111–141.
- Bebchuk, L.A., & Hirst, S. (2019). “The Specter of the Giant Three.” Boston University Law Review, 99(3), 721–741.
- Glosten, L., Nallareddy, S., & Zou, Y. (2021). “ETF Activity and Informational Efficiency of Underlying Securities.” Management Science, 67(1), 22–47.
- Investment Adviser Association (IAA). (2026). Asset-Weighted Active Manager Performance: A Reanalysis of SPIVA Data. IAA Active Managers Council.
- Korea Financial Investment Association. (2025). Korea ETF Market Statistics Q4 2025. Seoul: KOFIA.
- SEC. (2019). Exchange-Traded Funds: Final Rule (Rule 6c-11). Release No. IC-33646. Washington D.C.: SEC.
- Ben-David, I., Franzoni, F., & Moussawi, R. (2018). “Do ETFs Increase Volatility?” Journal of Finance, 73(6), 2471–2535.