
While browsing economic news last week, I noticed something strange.
On one hand, there are headlines about China’s semiconductor equipment investment hitting an all-time high, while right next to it, reports show China’s real estate construction area has slumped once again. It’s the same country, the same month, yet the statistics point in completely opposite directions. I thought it might be an illusion and dug deeper into the numbers, only to find that this wasn’t an illusion—it is the very structure that the Chinese economy is currently acknowledging. It is a picture that only becomes clear when you lay government documents side-by-side with official statistical releases.
Everything we will cover in this upcoming series—Dark Factories, the era of one agent per person, and Huawei’s supernodes—is happening on top of this structure.
So, before we dive into the colorful details, I want to use numbers to pinpoint exactly where the Chinese economy stands right now.
One PMI number shows China’s two faces
According to an IBK Securities report, as of August, the Purchasing Managers’ Index (PMI) for high-tech manufacturing was 52.9, and for equipment manufacturing, it was 51.4. Both are above the 50-point threshold that separates economic expansion from contraction. However, during the same period, the PMI for consumer goods manufacturing remained at 49.0 despite a month-on-month rebound, and the construction industry PMI, which is being hit hard by the real estate slump, fell to 46.9.
This means that while the semiconductor and high-tech equipment sectors continue to expand, traditional manufacturing like chemicals and non-metallic minerals are moving in the opposite direction.
For those unfamiliar with the PMI, it is an index created by asking corporate purchasing managers every month whether their orders, production, and inventory have increased or decreased compared to the previous month. A score above 50 means more companies reported an increase, while below 50 means the opposite.
Therefore, the 52.9 for high-tech manufacturing and the 46.9 for construction are not just a 6-point difference; they are numbers belonging to two different worlds—one where ‘business is growing’ and one where ‘business is shrinking.’
You cannot judge an entire economy by a single number. But when the trajectories diverge to this extent, it should be viewed as a structural issue rather than a seasonal fluctuation.
What exactly is K-shaped polarization?
At first, I thought the term ‘K-shaped’ was just a metaphor.
If you look at the letter K, the stroke pointing upward and the stroke pointing downward diverge from a single point. The Chinese economy right now looks exactly like that.
New economy sectors like semiconductors, software, and IT hardware are trending upward, while the old economy—real estate, essential consumer goods, retail, home appliances, and construction—is heading downward. It’s as if two branches splitting from the same root are moving apart at different speeds.
This gap doesn’t end with production indicators.
If you break down the performance of China’s A-shares (companies listed on the mainland Chinese stock market) by sector for the first half of this year, the contribution to overall net profit growth was 3.45 percentage points for IT, media, and telecommunications, while essential consumer goods recorded minus 1.23 percentage points and cyclical consumer goods recorded minus 0.59 percentage points.
In simple terms, the IT sector took almost all of the profit gains, while sectors like daily necessities and retail actually saw their profits shrink. According to Shinhan Securities Research, China’s retail sales in May fell 0.6 percent year-on-year, marking the first negative growth since 2023. The timing when consumption hit a wall perfectly overlaps with the surge in new economy profits.
The gap becomes clearer with import/export data
Since production and profit indicators might not be enough to get a full picture, I analyzed the import and export statistics.
As of May, China’s semiconductor exports were up 110.9 percent year-on-year. Computer and server exports rose 66.1 percent, smartphone exports 44.3 percent, and automobile exports 39.3 percent. Conversely, real estate development investment in the same month fell 16.2 percent. Domestic car sales dropped 16.1 percent, home appliance sales by 15.6 percent, interior materials by 13.6 percent, and furniture sales by 8.7 percent.
When placed side-by-side in two rows, the symmetry is almost eerie.
High-tech products heading overseas are increasing by double or even triple digits, while durable goods consumed domestically are shrinking by nearly the same magnitude.
I realized this isn’t a coincidence; it is evidence that one economy is moving toward two completely different sources of demand.
You can see the K-shape in a single company
National-level statistics can be hard to grasp. So, I decided to look at one specific company: the electric vehicle manufacturer BYD.
In the first half of this year, BYD’s new energy vehicle sales reached 1,808,511 units, down 15.7 percent from the same period last year.
However, when you split these numbers into overseas and domestic sales, the story changes completely.
Overseas sales volume jumped 70.7 percent to 792,256 units, while domestic sales in China dropped by nearly 40 percent.
Same company, same product, same quarter—but the report card varies drastically depending on where they are sold.
This is not a coincidence; it mirrors the national import/export statistics we looked at earlier.
The volume heading overseas is increasing, while the volume consumed domestically is shrinking.
It is as if the K-shaped structure of the national economy is shrunk down into the performance sheet of a single company.
On the other side of the spectrum, there are names like Country Garden, the real estate developer that faced a default crisis in 2023 after failing to pay interest on dollar-denominated bonds due to liquidity issues. The fact that this company is still cited as a symbol of the industry is proof that the picture of the old economy has not changed much for years.
BYD’s case is not just someone else’s problem for Korea.
As domestic demand weakens, the incentive to aggressively lower prices and push volume into overseas markets becomes even greater.
In fact, there are reports that the market share of low-cost Chinese EVs is noticeably rising in Korea as well. China’s domestic slump is paradoxically returning as price competition pressure on foreign automakers.
New economy vs. old economy: The money flows differently
An interesting point here is that this gap is not a result the market created on its own, but a result directly pushed by policy.
This year, China’s central government spending on science and technology reached 426.4 billion yuan, a 10 percent increase from the previous year, and 200 billion yuan was allocated in ultra-long special treasury bonds to support the replacement of aging equipment.
It is a structure where fiscal resources are concentrated in strategic industries such as integrated circuits (semiconductors), aerospace, biopharmaceuticals, and the ’low-altitude economy’ (new industries like drones or urban air mobility).
The financial sector is the same.
The People’s Bank of China increased the quota for its ‘science and technology innovation and technical transformation re-lending’ program—a system where the central bank provides funds to specific industries at low interest rates via commercial banks—from 800 billion yuan to 1.2 trillion yuan. As a result, new loans are flocking to policy-supported sectors like infrastructure, manufacturing, and technology, while the loan contribution to real estate and consumption has actually dipped into the negative.
With fiscal policy, bank credit, and capital markets all flowing in one direction, it is hard to expect the gap to narrow on its own.
New Quality Productive Forces: A card named by the government
Usually, such polarization is treated as a side effect that the government tries to fix belatedly. China, however, moved in the opposite direction. According to NetZero News, Premier Li Qiang personally presided over a related meeting and finalized a national development strategy based on two pillars: fostering ‘New Quality Productive Forces’ and green technology innovation.
‘New Quality Productive Forces’ literally means ‘qualitatively new productive forces,’ and the industries included here are exactly those where the PMI is currently soaring: semiconductors, AI, and eco-friendly energy.
In other words, the current K-shaped gap is not a side effect, but rather the result of resources moving in the direction the government has pre-determined.
It is a choice to focus firepower on the new economy instead of propping up the old economy, accepting the gap that grows in between.
According to an Asia Today analysis, the term itself has been a core national industrial strategy since President Xi Jinping first advocated it at the end of 2023.
In the meantime, the direction of building a ‘high-level scientific and technological self-reliance’ ecosystem to overcome external sanctions through future technologies like aerospace, AI, batteries, advanced robots, and critical minerals has been concretized, and it has been elevated to the backbone of the entire 15th Five-Year Plan. In short, it is more reasonable to view the current K-shaped gap not as a policy that emerged overnight, but as the process of a national strategy, refined over two years, being reflected in the real economy.
Why not save real estate and just accept this gap?
A question naturally arises here.
If they stimulated real estate and consumption, they could narrow the K-shaped gap much faster; why not use that card?
There are two overlapping reasons.
One is debt.
Chinese policymakers are well aware of the precedent where countries loosened fiscal policy to prop up real estate after the 2008 financial crisis, only to end up with a mountain of debt. There are diagnoses that the balance sheet recession Japan experienced in the 1990s—where companies and households avoid new investments while paying off debt, leading to a long-term economic slump—is already partially appearing in China. With the debt of local governments and real estate developers already near a critical threshold, using large-scale stimulus again carries a high risk of triggering a larger debt-deflation cycle (a vicious cycle where consumption and investment shrink together as people pay off debt) in the long term, even if it yields a short-term rebound. (We will dive deeper into this debt issue in Part 5 of this series.)
The other reason is the more urgent task of technological self-reliance.
With external pressures like semiconductor export controls continuing, if they divert resources back to the old economy now, they could lose the golden time for the technological catch-up that ‘New Quality Productive Forces’ aims for.
In other words, from the Chinese government’s perspective, they have chosen ‘painful but controllable polarization’ over ‘comprehensive but debt-increasing stimulus.’ Whether this choice is correct remains to be seen, but at least the policy flow so far has consistently avoided the latter. At the very least, at this point, it means that managing debt ratios is treated as a more important variable than a few percentage points of growth.
The 15th Five-Year Plan: The weight of New Quality Productive Forces in 62 chapters
This strategy doesn’t end with one announcement. According to an analysis by the Korea Institute for International Economic Policy (KIEP), the ‘Proposals for the 15th Five-Year Plan’ for economic and social development from 2026 to 2030 were deliberated and passed at the plenary session of the CPC Central Committee held in October 2025. This document consists of 12 fields and 49 items, including economy, science and technology, reform and opening-up, society, security, and national defense, with the goal of basically realizing Chinese-style modernization by 2035.
According to HelloDD, this plan consists of 62 chapters, and the entire Part 3 is grouped under the title ‘Accelerating high-level scientific and technological self-reliance to lead the development of New Quality Productive Forces.’
Part 4, which follows immediately, is ‘Deepening the construction of a Digital China and improving the level of digital and intelligent development,’ where the goal of applying AI across all industries is covered in a separate chapter.
Since they dedicated the first two parts of the Five-Year Plan entirely to technological self-reliance and AI diffusion, this is closer to a practical blueprint for resource allocation for the next 5 years than just a slogan. In other words, it is more accurate to view ‘New Quality Productive Forces’ not as one of 49 items, but as the technological foundation that the remaining items must rely upon.
Capital markets are also on the side of the new economy
While fiscal and bank credit are pouring into the new economy, the same trend has been repeating in the stock market.
According to an Economy Chosun analysis, since the ‘STAR Market (Shanghai’s tech-focused stock market, equivalent to the Chinese NASDAQ) 1+6 Reform’ in June last year, the capital market access path for strategic industrial tech companies like AI, semiconductors, and robots has widened, and IPO fundraising is actually showing signs of recovery, centered on the STAR Market. In 2025, the Hong Kong stock market reclaimed the top spot in the global IPO market with 117 company listings and 285 billion HKD raised, and the fundraising scale of the Shanghai STAR Market and the Shenzhen ChiNext (also a stock market for tech/venture companies) nearly doubled compared to the previous year.
The point to note is where this money is flowing.
The stars of the 2026 China/Hong Kong IPO market are tech and advanced manufacturing companies that are direct beneficiaries of the 15th Five-Year Plan, and among them, commercial aerospace and semiconductor-related supply chain companies are receiving the most attention.
Following fiscal and bank credit, the funding path for direct financial markets is also widening only toward the new economy. With all three funding channels pointing in one direction, it seems like the market itself already knows the rules of the game.
For new economy companies, it means that three funding sources—government fiscal support, bank loans, and stock market listings—are open simultaneously, so it would be hard to find a more favorable combination.
When will the K-shaped gap narrow?
So, when will this K-shaped polarization end? Kim Ye-seul, a researcher at IBK Securities, pointed to the solidification of this gap as the biggest source of anxiety for the Chinese economy, diagnosing that while the new economy continues to see capital inflows through policy, credit, and capital markets, the old economy has no choice but to rely on a recovery in domestic demand itself.
As long as policy continues to flow toward the new economy, it means that the gap is unlikely to narrow until the old economy rebounds on its own.
If that’s the case, where can we first spot the signal that this gap is narrowing?
Personally, I think checking the consumer goods manufacturing PMI and the construction industry PMI every month is the most intuitive method.
Right now, they are stuck below 50 at 49.0 and 46.9 respectively; the point when both simultaneously recover the 50-line will likely be the signal that the old economy has started to rebound on its own. Until then, I intend to use these two numbers as a compass to gauge the direction of the entire series. Conversely, if only the new economy PMI continues to rise while these two numbers remain stagnant, we must assume the K-shaped gap has solidified into a structural feature lasting several years.
Personally, I want to add one more thing to this diagnosis.
The fact that ‘New Quality Productive Forces’ accounts for nearly one-third of the entire 15th Five-Year Plan also means that resolving this gap has been pushed to the back of the priority list for the 5-year national plan.
In other words, the current K-shaped curve is not a temporary phenomenon that will resolve within a few months, but a structure likely to be maintained in this shape at least until 2030.
Ultimately, the attempt to summarize the Chinese economy with a single number seems meaningless. We are in a situation where we must ask “Which side of China are you looking at?” rather than “Is the Chinese economy doing well or poorly?”
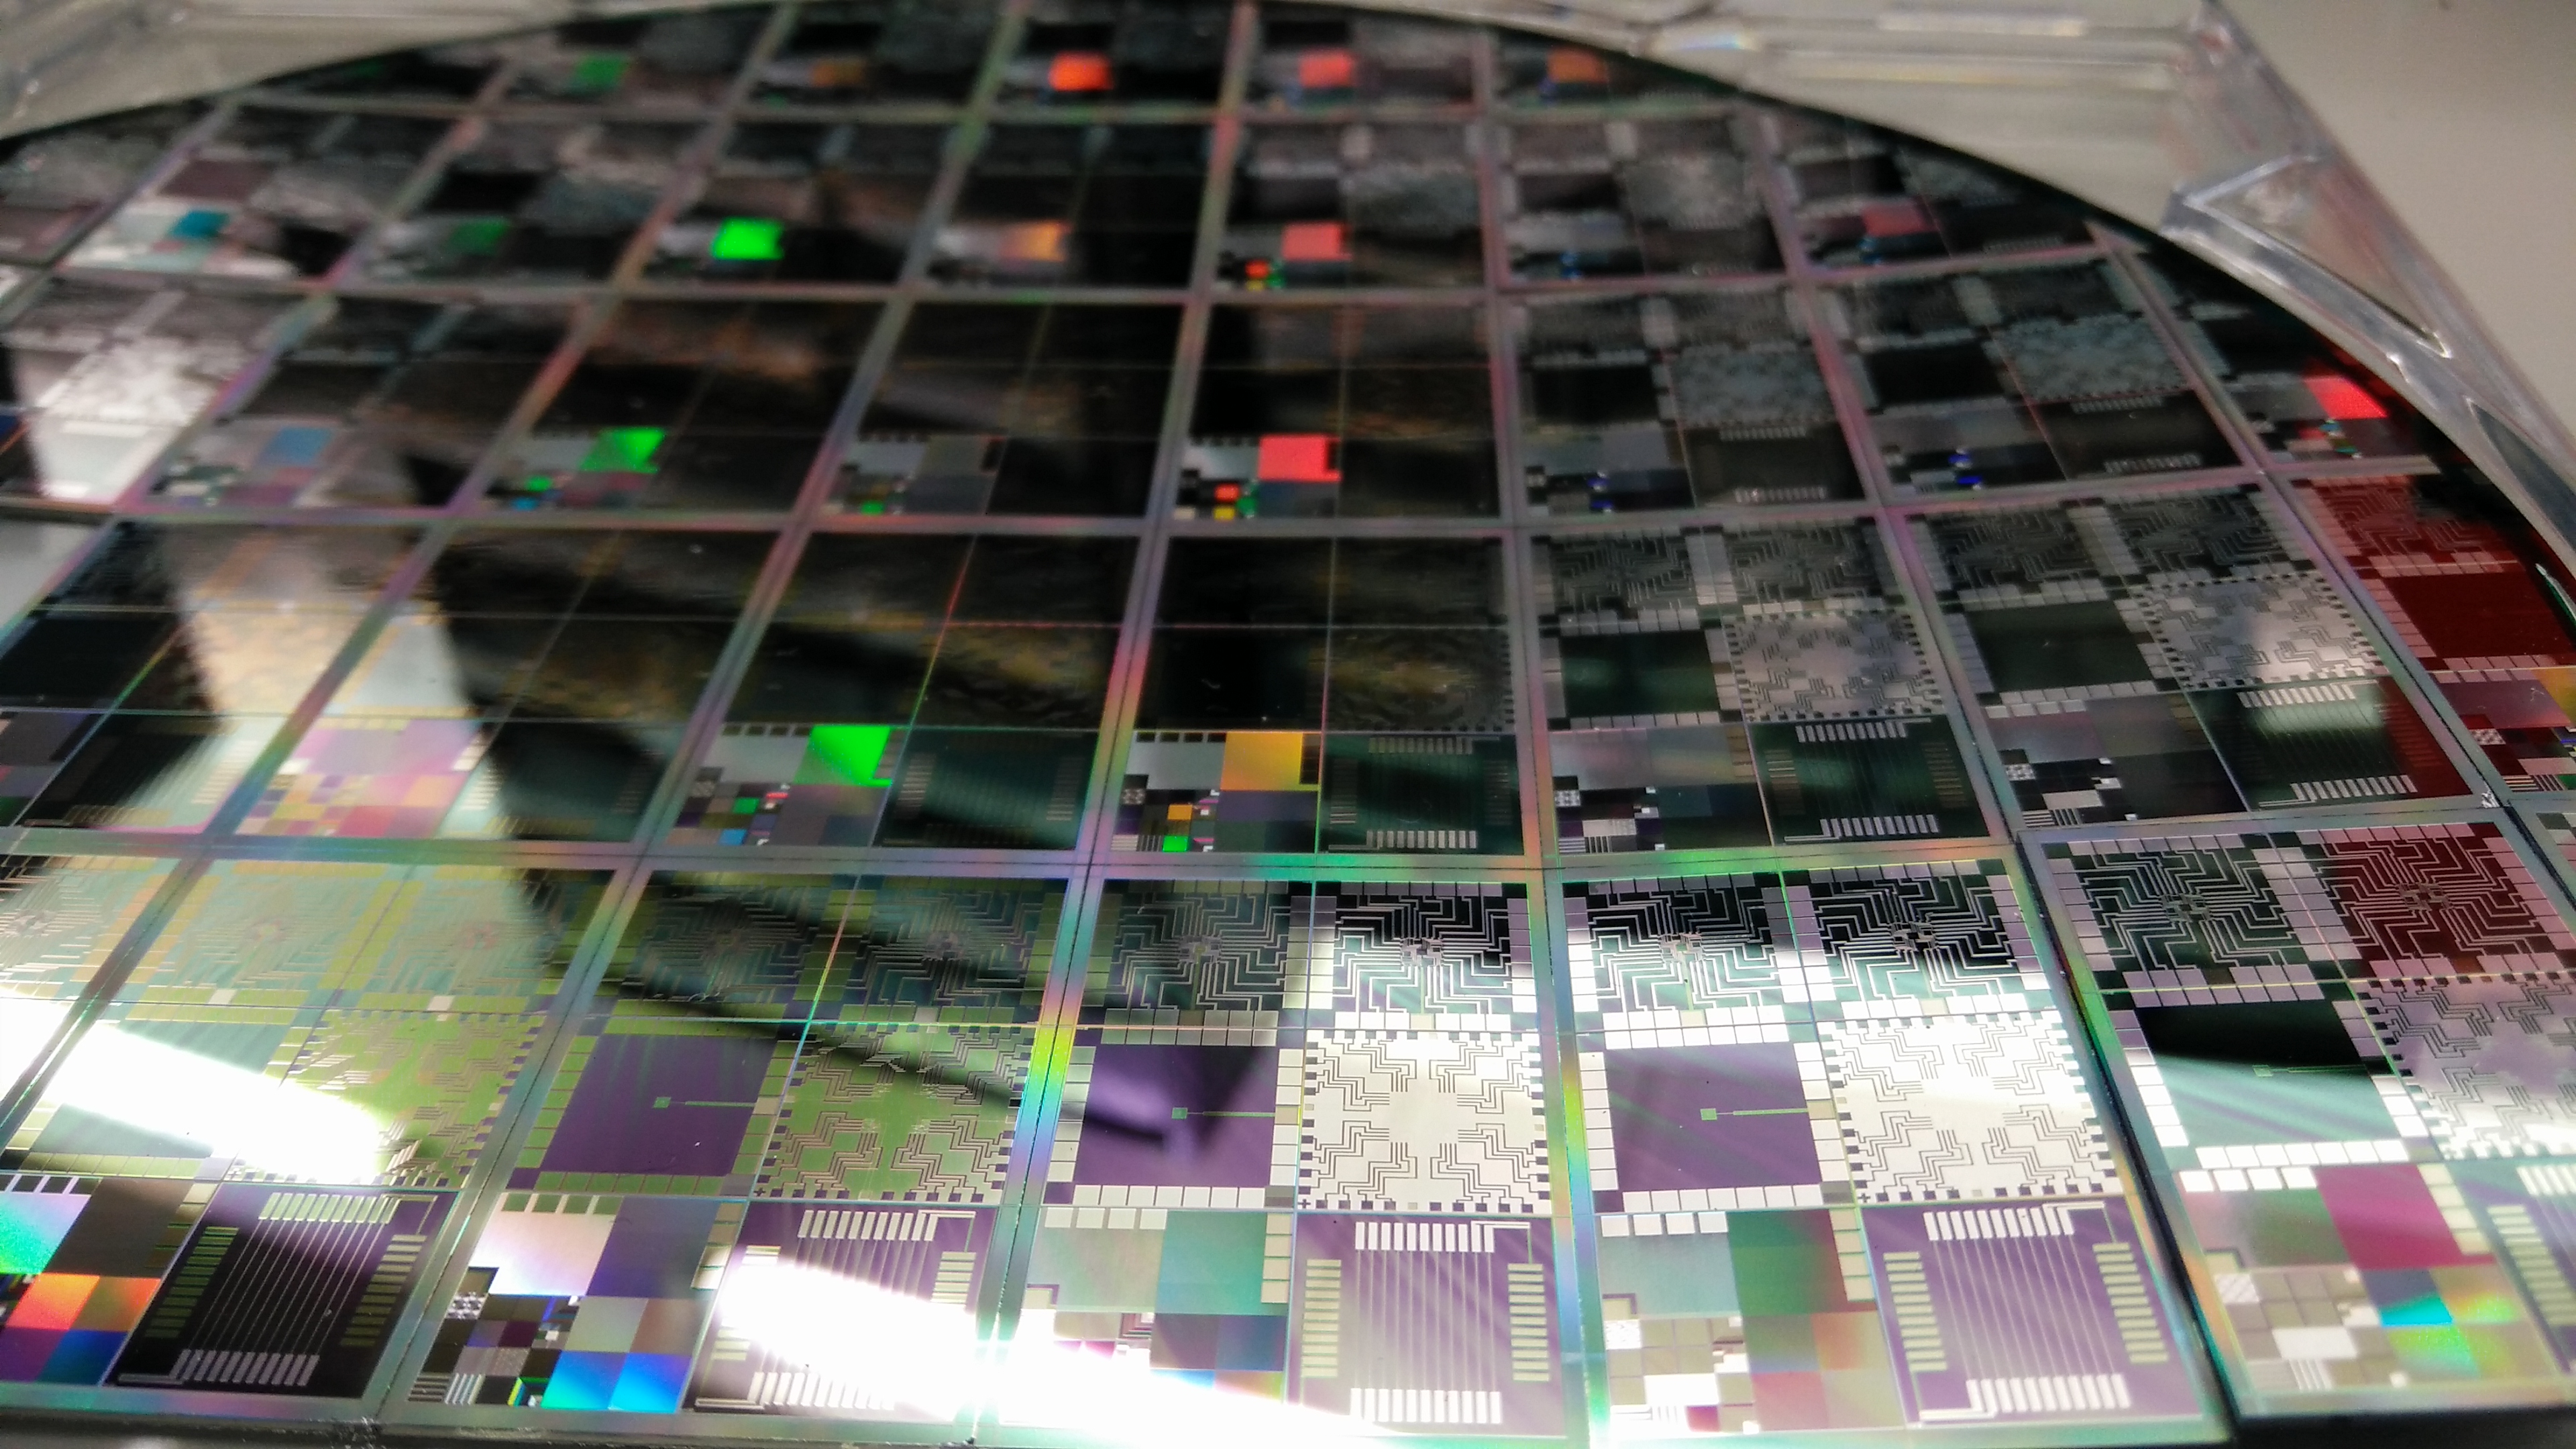
On top of a semiconductor wafer, world-class competition is taking place, while right next to it at a construction site, cranes have been standing still for years.
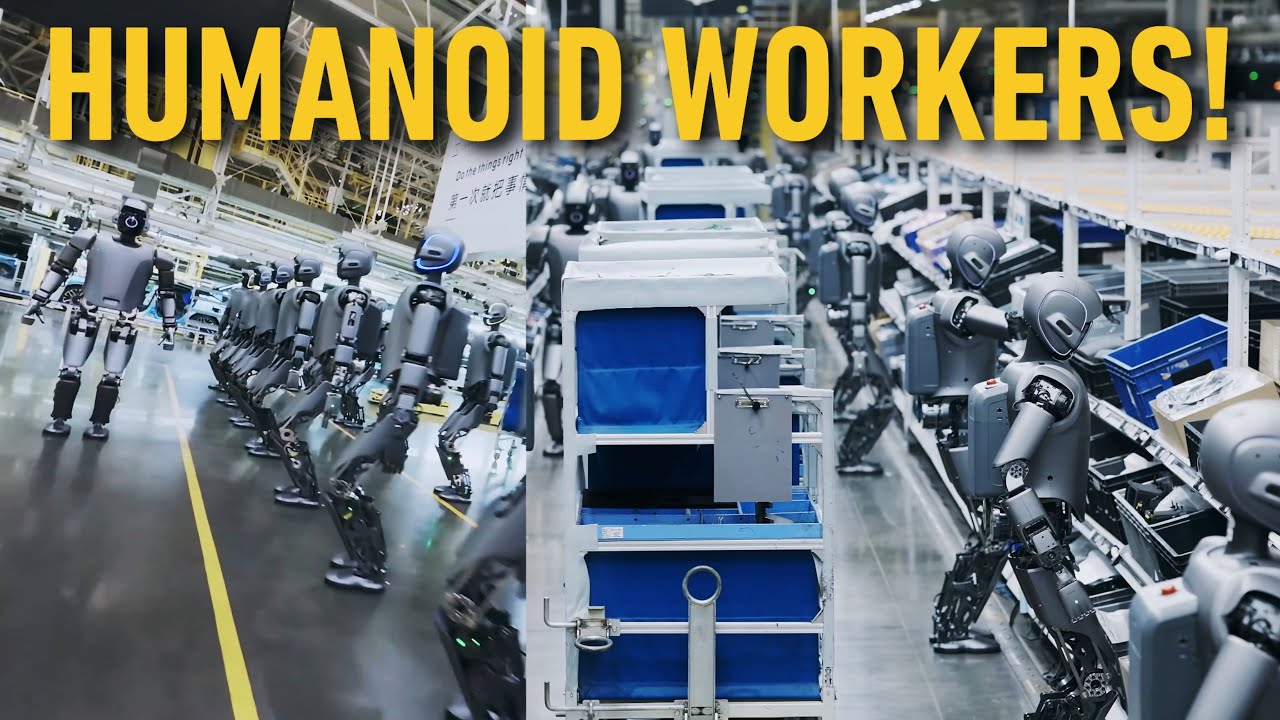
Dark factories, AI agents, and Huawei’s infrastructure strategy, which will follow in this series, are all things happening on the upper stroke of this K-shaped graph, and the lower stroke—the shadow of balance sheet recession and youth unemployment—will be examined separately later.
References
- China's economic 'K-shaped polarization' deepens... IBK Securities: "Growth and profit gap between new and old economy expands"
- [Trade and Industrial Policy Newsletter] Analysis of China's 15th Five-Year Plan
- Industrial strategy shift of China's 15th Five-Year Plan and the impact and response for our industry
- Economic policy direction and implications of China's 15th Five-Year Plan
- China economic indicator review: Where is the Chinese economy heading now?
- China's calculated IPO boom and the 15th Five-Year Plan industrial promotion
- What should we watch in the Xi Jinping regime amidst the global complex crisis?